Látni és bizonyítani
amikor a megfigyelés maga is hibázik, és amit szándékosan nem rögzítek
when the monitoring itself fails, and what I deliberately do not record
Röviden, előismeret nélkül. Egy ügynököket futtató rendszerben minden művelet nyomot hagy, vagy hagynia kellene: ki kérte, melyik ügynök dolgozott, milyen eszközt hívott, mennyibe került, és mi lett a vége. Ezt a nyomot szabványos formában, külső figyelőrendszerbe is ki tudom vezetni. Megmutatom, mit rögzítek és mit nem, hogyan romlott el egyszer az egész úgy, hogy semmi nem jelzett, és mi hiányzik még. A rész a korábbiak nélkül is érthető.
An English version of this article follows below. Jump to the English version.
„Másodszor is megégettem magam ugyanazzal.” A harmadik részben egy kapu hetekig nulla elutasítást mutatott, és a nulla nem azt jelentette, hogy a szabályok jók. Most a megfigyelés maga hallgatott: a mérések exportálása „működött”, miközben a fogadó oldal a javítás leírása szerint minden kérést visszautasított, én pedig semmit nem láttam belőle.
A harmadik rész tanulsága az volt, hogy a hallgatás nem bizonyíték. Ez a rész ennek a fordítása a megfigyelésre: ha a rendszerem azt mondja, hogy figyel, abból még nem következik, hogy lát. A megfigyelésnek is kell megfigyelés. Elmesélem, hogyan jöttem rá erre másodszor, mit rögzít most a rendszerem, mit nem, és mi hiányzik még.
A sorozat kérdése változatlan: mit ad egy kisvállalkozásnak vagy egy nagyobb cégnek az, hogy az eredeti személyes asszisztenst a saját rendszeremmé fejlesztettem tovább? A megfigyelés terén a válasz az, hogy egy cég nem azt kérdezi, mennyi mérést gyűjtök, hanem azt, hogy ha valami elromlik, abból látok-e valamit, és ki tudom-e mondani, mi történt. A 10. pontban leírom azt is, hol maradt a helyzet kínos.
1. Mit akarok látni?
Képzeljünk el egy kérést. Egy felhasználó kér valamit az első ügynöktől, az hív egy eszközt, majd átad egy részfeladatot egy másik ügynöknek, amely szintén hív egy eszközt. A végén van egy eredmény, és van egy költség. Három kérdésem van ezzel kapcsolatban. Mi történt, és milyen sorrendben? Ki csinálta, pontosabban kinek a nevében? Mennyibe került?
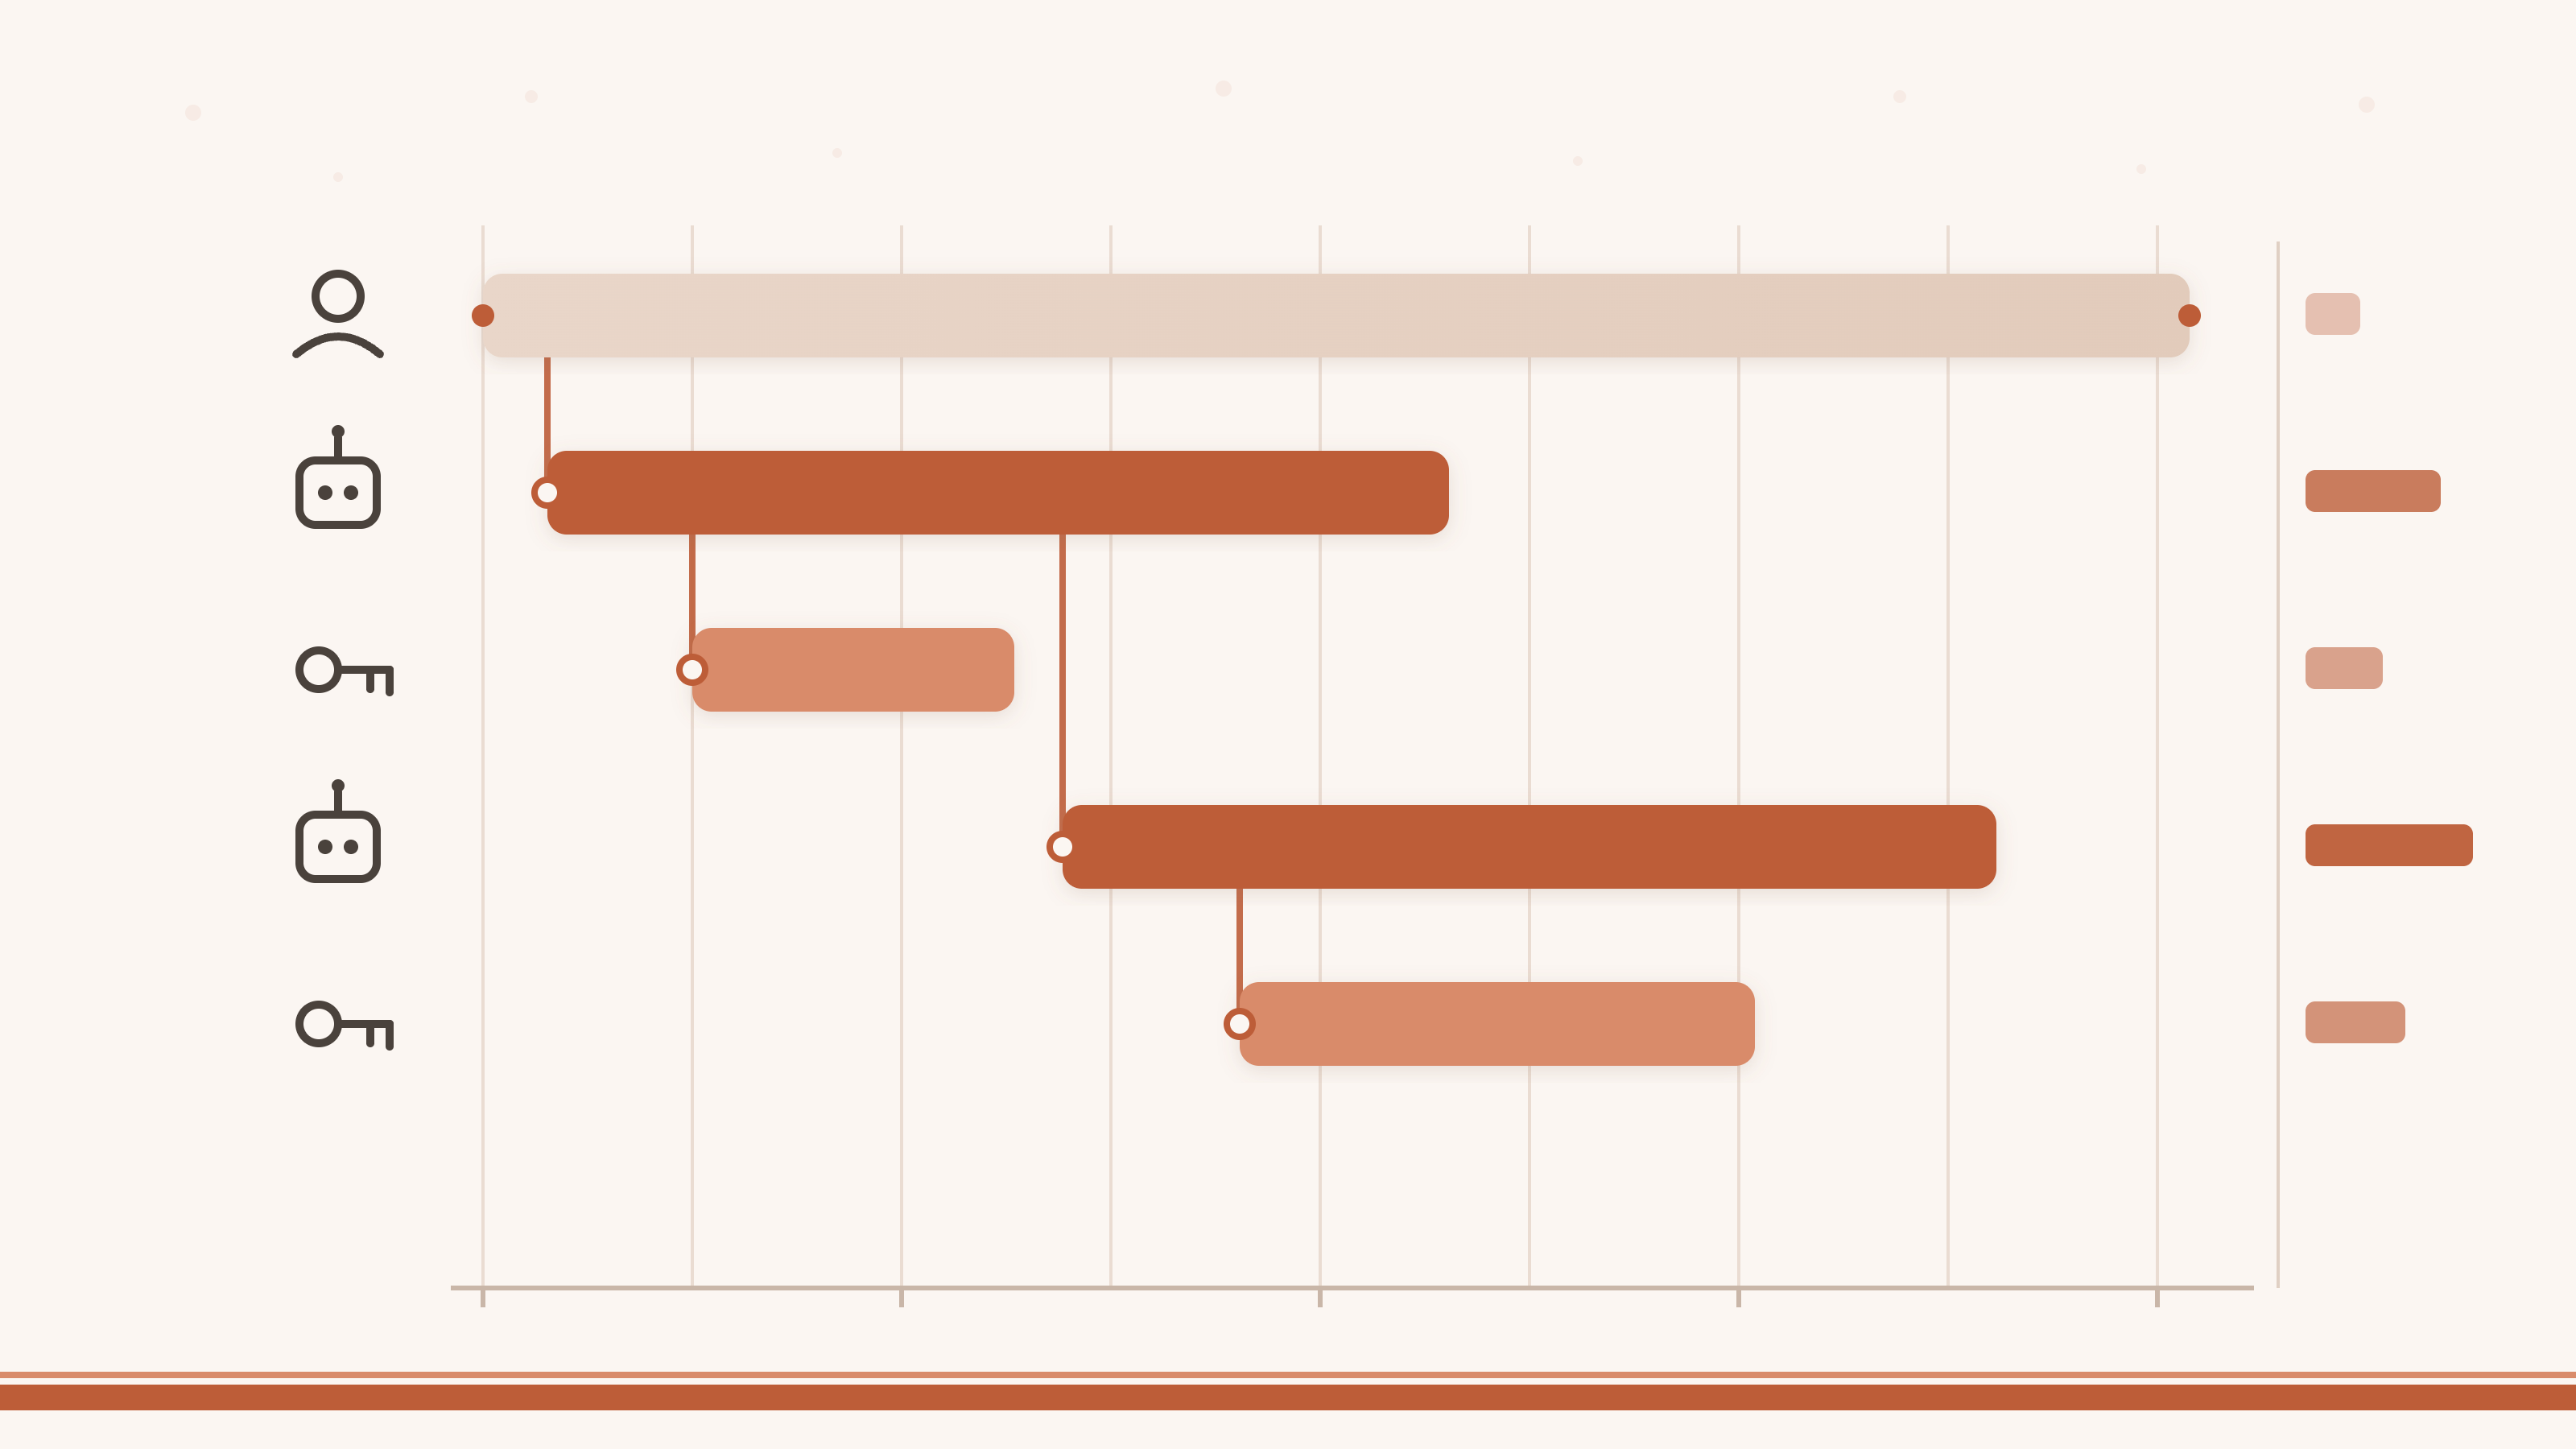
Az első kérdésre az idősávos nyomvonal válaszol. Ez egy kérés lépéseit mutatja időtengelyen: minden lépés egy sáv (a szakasz), a sáv hossza az idő, a lépcsőzés a sorrend. A cikk fejlécében lévő ábra ilyen, de ez illusztráció, nem a rendszerem kimenete. A második kérdés a harmadik rész kérdése: nem elég tudni, melyik ügynök dolgozott, azt is tudni kell, kinek a nevében. A harmadik kérdésre a költség-mérés felel, erről a 6. pontban írok.
Az üzemeltethetőség próbáját korábban már leírtam; ez a rész ugyanennek a láthatósági oldala: aki üzemeltet, annak az is kérdés, hogy ha valami nem működik, kiderül-e.
2. Közös nyelv: OpenTelemetry
Nem akartam saját formátumot kitalálni. Az OpenTelemetry egy szabványos, gyártófüggetlen leírás arról, hogyan lehet méréseket küldeni egy külső gyűjtőnek (a gyűjtő az a rendszer, amely a méréseket fogadja, tárolja és megjeleníti). Három jelfajtája van: a nyomvonal (szakaszokból áll, ezek az idősávos nézet sávjai), a metrika (időben változó számok, például tokenhasználat) és a napló (egyedi események). A szabványosodásról egy korábbi cikkben írtam; itt a gyakorlati érv az, hogy ami szabványos, azt nem kell egyetlen megjelenítő programhoz kötnöm.
Hogyan néz ez ki nálam? A rendszerem az OpenTelemetry saját átviteli protokollján (OTLP/HTTP), JSON formában küldi a nyomvonalat, a metrikát és a naplót. A nyomvonal és a metrika az elejétől része, a napló-jelfajta október közepe óta van meg, és csak akkor megy ki, ha bekapcsolom. A kimenő kérések 30 másodperces ciklusban, kötegekben mennek, kötegenként legfeljebb 500 szakasszal, 10 másodperces időkorláttal; ha a gyűjtő nem válaszol, a rendszer növekvő szünetekkel próbálkozik újra. Ezek rögzített értékek, felületről nem állíthatók.
A beállítások nagy része a Beállítások képernyőn él, újraindítás nélkül hat: be vagy ki, a gyűjtő címe, a szolgáltatás neve, a naplók kapcsolói. Az alapérték minden jelfajtánál a kikapcsolt állapot. A hitelesítő fejléc (jellemzően egy hozzáférési kulcs) csak környezeti értékből adható meg, nem a felületről, és csak titkosított kapcsolaton vagy zárt hálózaton megy ki; hitelesítő adat a címben tilos, az átirányítást pedig letiltottam.
Néhány dolog nincs. Nincs gRPC és nincs más protokoll. Nincs egyedi tanúsítvány, kliens-tanúsítvány vagy a tanúsítvány-ellenőrzés beállítása. Nincs mintavételezés: minden lezárt szakasz kimegy. Nincs önálló SIEM-kivezetés (a SIEM a biztonsági események központi figyelőrendszere); az egyetlen út a naplók OTLP-n át egy külső gyűjtőbe. Úgy látom, ezek már nem a kisvállalkozások szintje: csak nagyvállalati környezetben van rájuk igény, és egyelőre nem ez a megcélzott felhasználói kör.
Az attribútumok nevei közül sokat az OpenTelemetry formálódó, MI-specifikus konvenciója szerint adok meg (modell, szolgáltató, tokenhasználat, eszköz neve). Hogy ez a konvenció pontosan hol tart, és hogy a neveim egyeznek-e a specifikáció mai változatával, külső forrásból most nem tudtam ellenőrizni. Ezért csak annyit állítok: a neveket a kódban használt állapothoz igazítottam, és nem mondom, hogy megfelelnek a specifikáció mai változatának.
3. Mit rögzítek, és mit nem
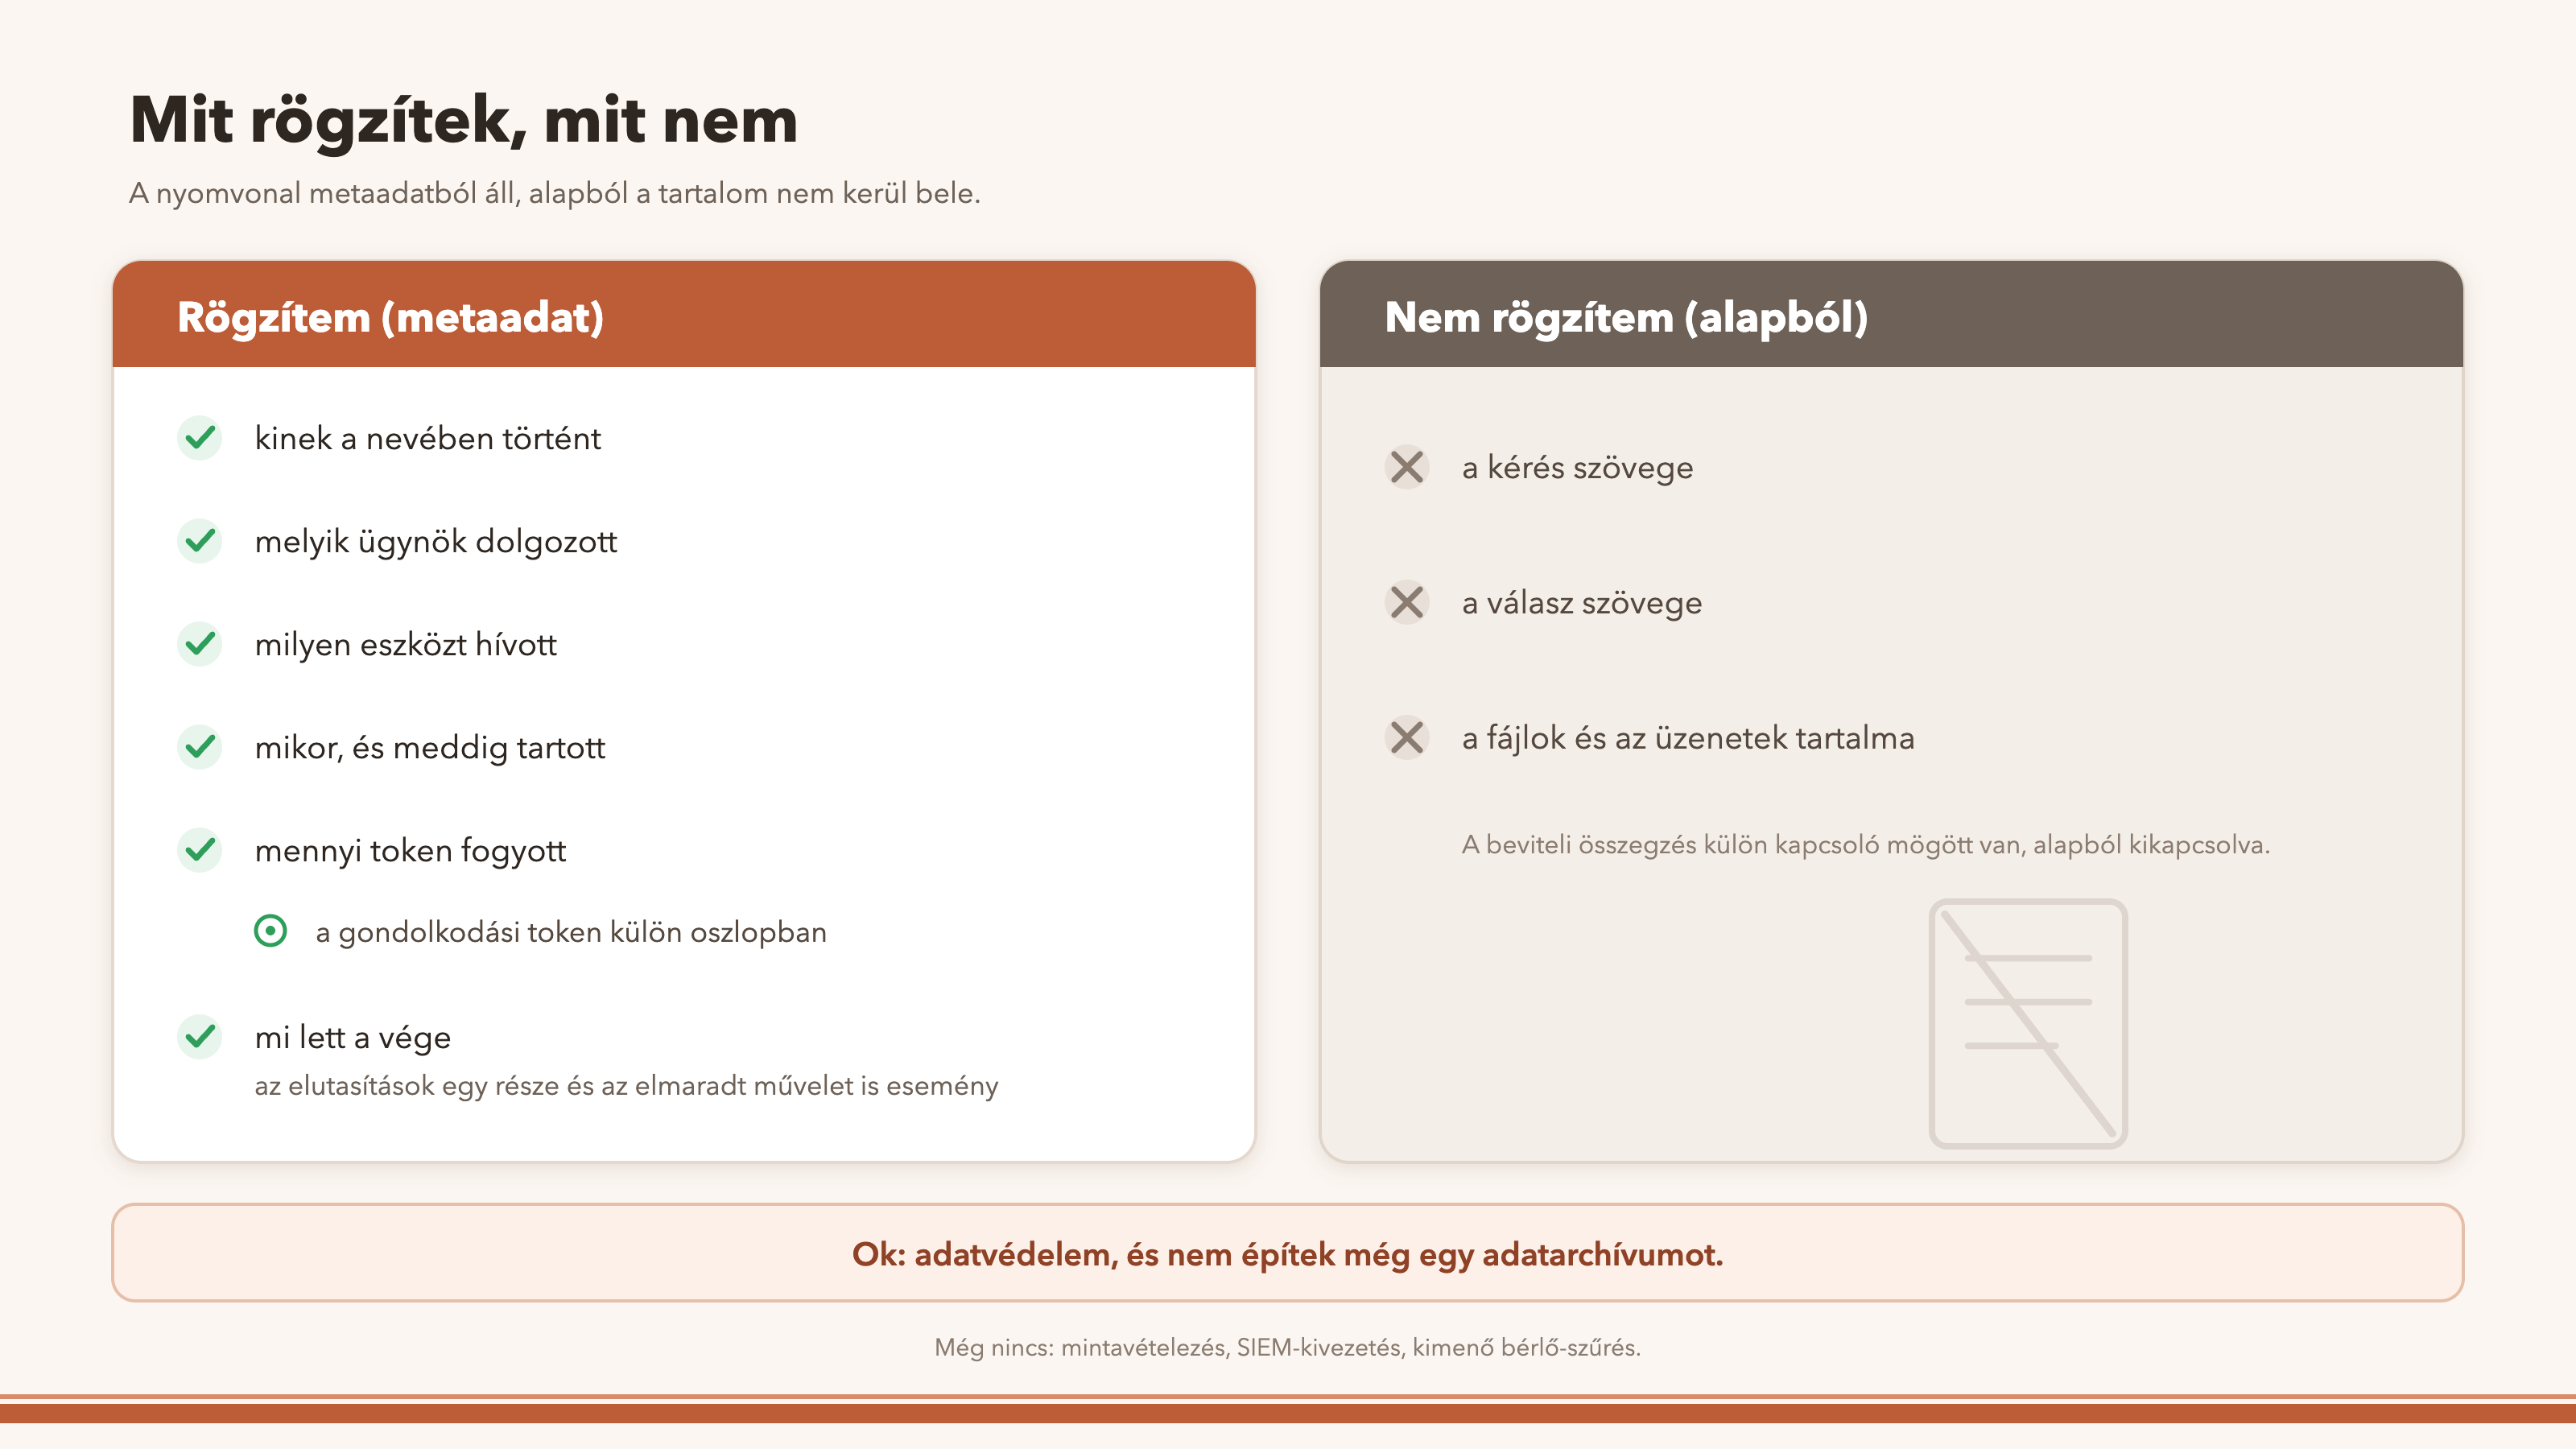
Egy szakaszban a következő metaadat szerepel: a modell és a szolgáltató, a tokenhasználat (a token a modell által feldolgozott szövegegység; bemenet, kimenet, gyorsítótár-olvasás, gyorsítótár-létrehozás), az eszköz neve, az MCP-kiszolgáló (az eszközöket kiszolgáló program) és az azon belüli eszköz, az ügynök azonosítója és neve (csak az ügynöki szakaszon), a bérlő-azonosító (a bérlő egy külön kezelt felhasználói szervezet), az üzenetek feladója és címzettje. A szakaszok neve is leíró: egy modellhívás, egy eszközhívás vagy egy ügynök-hívás. A gondolkodási token (amikor a modell a válasz előtt „gondolkodik”) külön oszlopban él a tárolásban, az exportban viszont a gyorsítótárral együtt egy „egyéb” összegbe kerül.
A tartalmat alapból nem rögzítem. Az auditnapló exportja nem visz ki tartalom-oszlopot, a felhasználók álnévvel (kulcsolt lenyomattal) szerepelnek, az alkalmazásnapló csak a sablont küldi, hitelesítő adattól és útvonaltól megtisztítva és 160 karakterre vágva. A bejövő kérés rövid összegzése külön kapcsoló mögött van, és alapból ki van kapcsolva. Egy fenntartásom van: a szakaszok attribútum-szűrésének pontos határát nem vizsgáltam végig, ezért a „tartalom nem kerül bele” mondatot az auditnaplóra és az alkalmazásnaplóra mondom ki, a szakaszokról csak annyit, hogy az összegzés külön kapcsoló mögött van.
Az okok kettősek. Az egyik az adatvédelem: a nyomvonalnak ahhoz, hogy hasznos legyen, nem kell tudnia, mit írt valaki. A másik gyakorlati: nem akarok még egy adatarchívumot építeni a meglévő mellé, amelyet külön kellene védenem és törölnöm. A megtartás is ehhez igazodik: a szakaszokat alapból 30 napig őrzöm (7 napnál rövidebbre nem állítható), az audit-táblákat 90 napig.
4. A néma export
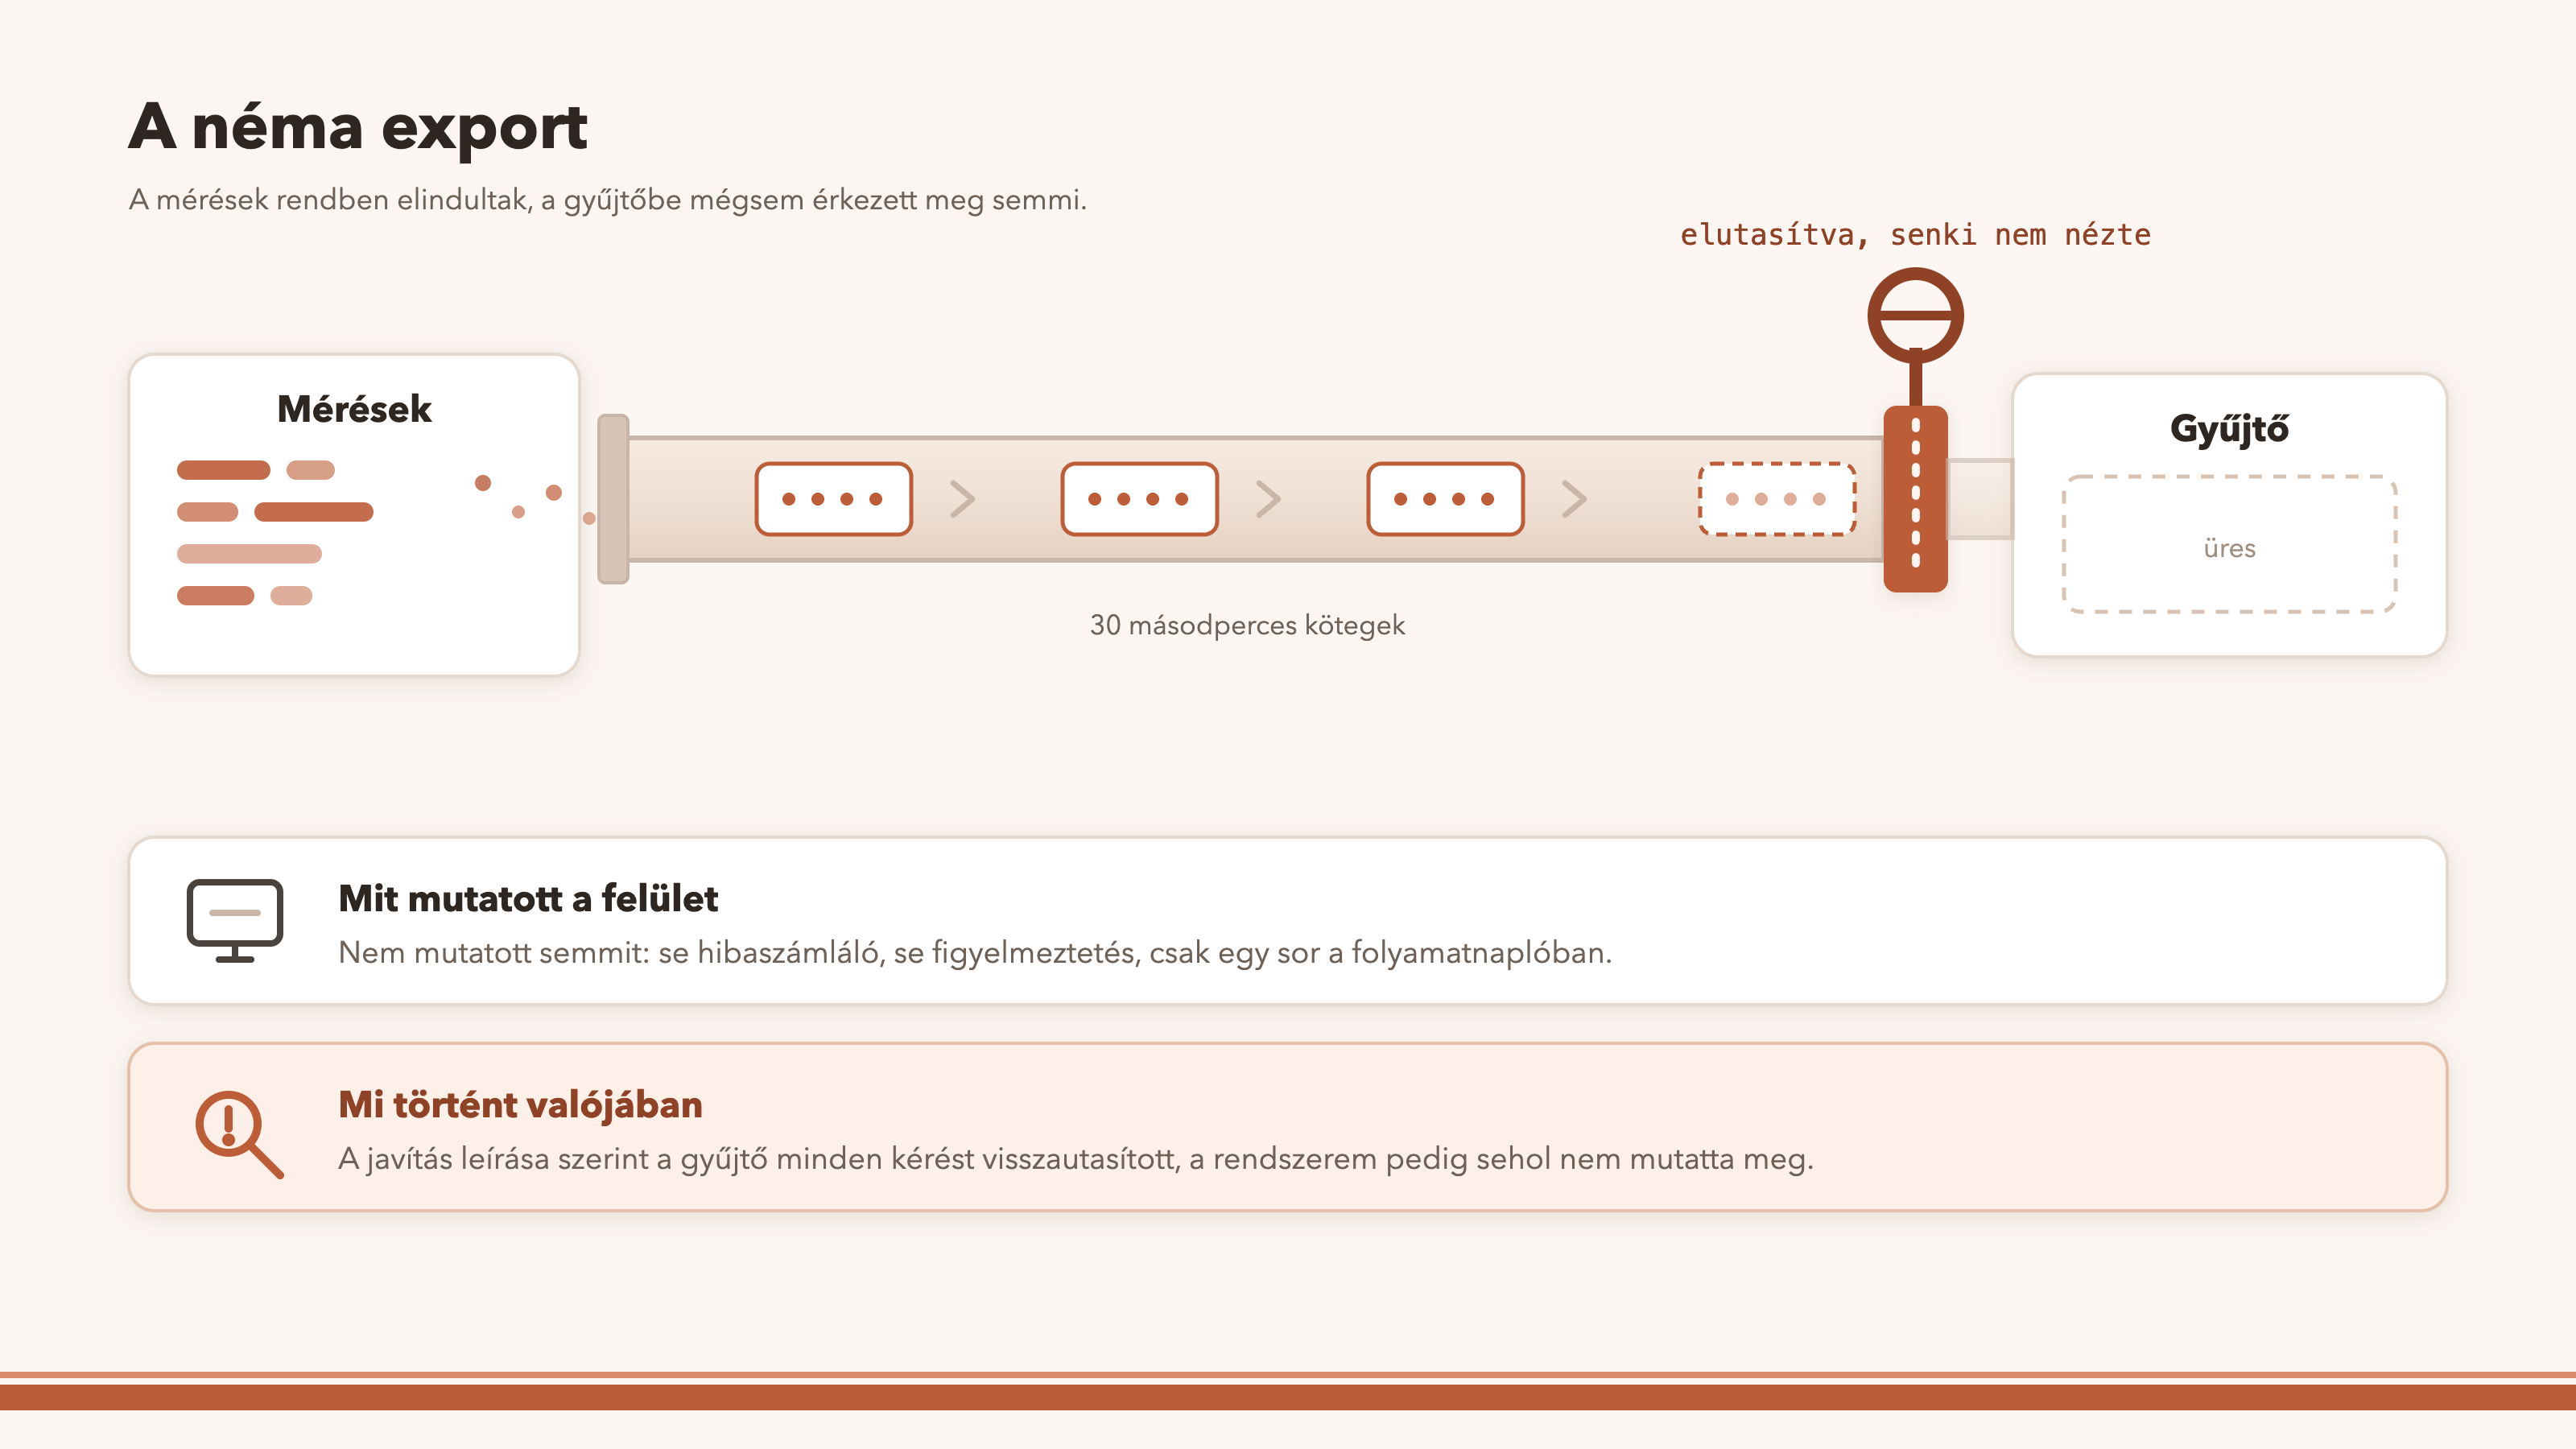
2026. szeptember 9-én kapcsoltam be az exportot a felületről; a beállítás-naplóban ez 15:17-kor szerepel. Másnap hajnalban, 04:20-kor készült el a javítás, és 04:32-re be is került. A bekapcsolástól a javításig nagyjából tizenhárom óra telt el. Egy egész naptári nap sem. Mégis ide kívánkozik, mert a lényeg nem az, hogy mennyi ideig tartott, hanem az, hogy ez alatt semmi nem szólt.
A hiba egyszerű volt. A szabvány a nyomvonal-azonosítót 32, a szakasz-azonosítót 16 hexadecimális karakterben várja. Én a munkamenet-, üzenet-, eszközhívás- és átirat-azonosítókat adtam át, kisbetűsítve, kötőjelek nélkül, és ezek nem ilyen hosszúak. A javítás leírása szerint a szabványos gyűjtők ezt jellemzően 400-as hibakóddal utasítják vissza, a rendszerem pedig a felületen ezt sehol nem mutatta meg. Hogy az akkori gyűjtő pontosan mit válaszolt, azt a naplóból nem olvastam vissza, ezért ezt nem állítom megfigyelt tényként. A javítás óta az azonosítót egy determinisztikus, SHA-256 alapú értékből vágom a kívánt hosszúságúra, így ugyanabból a bemenetből mindig ugyanaz lesz.
Mit láttam a felületen? Semmit. A rendszer a folyamatnaplóba írt egy figyelmeztető sort („a gyűjtő elutasította az exportot”), a köteg nem lett exportáltnak jelölve, de hibaszámláló, állapotsor vagy figyelmeztetés a felületen nem volt.
Mi változott azóta? A rendszer a 400, 413, 415 és 422 választ véglegesnek veszi: a köteget eldobja, és megszámolja. Minden más nem sikeres választ újra próbál. Ha a gyűjtő részlegesen fogadja el a kérést, az elutasított rész is számolódik. Két számláló jelzi ezt, jelfajtánként. Ez jó, de van egy hibája, és ez ugyanaz a hiba, mint a néma exporté: ezeknek a számlálóknak ma nincs fogyasztójuk. Nincs hozzájuk se felületi képernyő, se végpont. Ráadásul csak akkor jutnak ki, ha a gyűjtő újra elérhető, vagyis éppen a hibázó gyűjtő nem látja őket. A megfigyelésnek tehát ma sincs saját nézete.
5. A nulla és a kanári
A harmadik rész szabálya, hogy a nulla nem bizonyíték. Azóta egy újabb mérésnél is alkalmaztam, és ez a rész legtanulságosabb kis példája.
A megosztott hozzáférési kulcs használatát egy számláló méri, mielőtt a megosztott kulcsot ténylegesen letiltanám. Ez a számláló csak számol: semmit nem enged és nem tilt. Aggregált napi sorokat vezet (nap, kategória, útvonal-sablon, hívó, a hívó azonosításának módja), 90 napig őrzi, és napi 4000 soros plafonja van. Ha a végén nullát mutat, két magyarázat van: senki nem használta a kulcsot, vagy a számláló nem él. A kettő kívülről egyformának látszik.
Ezért a döntési kapu (az az ellenőrzés, amely a letiltásról dönt) minden futás elején szándékosan egy kanári-hívást tesz (egy ismert, kézzel kiváltott használatot), és a mai számlálónak legalább eggyel nőnie kell. Ha nem nő, az eredmény „nem eldönthető”, és soha nem „megfelelt”. A szabály a kapu kódjában ott van. Hogy a számláló valaha tényleg halott volt-e, azt nem tudom állítani; a példa a szabályrendszerből igazolt, nem egy megtörtént esetből.
A második csapda az idő. Egy havi vagy ritkább ütemezésű feladat kimaradhat egy legalább nyolcnapos mérési ablakból (hét teljes nap és a mai nap), és ilyenkor a nulla megint nem azt jelenti, amit hinnék. Ezért az ablakban a feladatot kézzel is le kell futtatni, különben az eredmény ugyanúgy „nem eldönthető”. A megfigyelés megfigyelése nálam tehát két szabály: a nullának bizonyítottan élő számláló mögött kell állnia, és az ablaknak le kell fednie az ütemezést.
6. Költség: tokenben, jelzéssel
A költségmérést a rendszer tokenben végzi, nem pénzben. Nincs árlista a könyvelésében, ezért a keret is a tokenmennyiséghez viszonyít, és nem forintot vagy dollárt mutat. A tokeneket külön oszlopokban tárolom: bemenet, kimenet, gyorsítótár-olvasás, gyorsítótár-létrehozás és gondolkodás. A gondolkodási token tehát külön oszlopban megvan.
A költségkeret a havi tokenhasználatot a megadott kerethez viszonyítja. Nyolcvan százaléknál figyelmeztet, száz százaléknál kemény jelzést ad, üzenetet küld a beállított csatornára (ezen a telepítésen ez a Telegram), és szünetidőt tart, hogy ne zaklasson. Csak jelez, nem állít le: a „leállítás” mező a szöveget módosítja, tényleges akció nincs mögötte. Az ellenőrzés függvénye, a parancsa és a sablonja létezik, a rendszeres, ütemezett ellenőrzés viszont ezen a telepítésen nem fut. Ezt a döntést tudatosan hoztam, és ezért a költségkeretet jelzésként írom le, nem működő védelemként.
Egy dolgot külön leírok, hogy ne értse félre senki: ha a havi használat eléri a keret 100 százalékát, a rendszer attól még nem áll le. A helyben futó munkák (a helyi modellel végzett memória-keresés és a modell nélkül futó, parancs-típusú ütemezett feladatok) tovább élnek és működnek, mert nem fogyasztanak felhős tokent. A felhős hívásokat sem állítja le a keret, hiszen az csak jelez.
7. Az ügynökök közti nyom
Az ügynökök egymásnak üzennek, és szeretném látni, hogyan vándorol egy kérés köztük. Egy példával mutatom meg, mit látok ebből, és mit nem. A példa kitalált.
Egy felhasználó azt kéri az A ügynöktől, hogy készítsen havi összefoglalót. Az A ügynök ezt nem tudja egyedül, ezért üzenetet küld a B ügynöknek: gyűjtse ki a számokat. A B ügynök dolgozik, majd válaszol. Az A ügynök a számokból megírja az összefoglalót, és átadja a felhasználónak. Négy lépés van: a kérés, az üzenet A-tól B-nek, a válasz B-től A-nak, és a végső válasz.
Mi köti össze az üzeneteket? Egy azonosító, olyasmi, mint egy ügyszám. Az üzenet-tábla soraiban három azonosítónak van hely: a nyomvonal-azonosítónak (ez az ügyszám, a lánc minden tagján ugyanaz), a szakasz-azonosítónak (az üzenet saját azonosítója) és a szülő-azonosítónak (az, hogy a küldő melyik, hozzá utoljára megérkezett üzenet után küldte). A rendszer tölti ki őket kézbesítéskor. A küldő nem adhat meg ilyet. Közben létrehoz egy üzenet-szakaszt is. Ebben a feladó és a címzett neve áll. Így a két üzenet egy láncot alkot: látom, hogy az A ügynök kérdezett, a B ügynök válaszolt, és mikor. A lánc azt mutatja, melyik üzenet után melyik jött. Azt nem, hogy az egyik valóban a másik miatt született.
Ennél kevesebbet tudok, három okból. Az első: a B ügynök nem látja az ügyszámot, mert az üzenet szövegében nincs benne. A második: amit a B ügynök közben csinál (olvas, számol, eszközt hív), az nem az ügyszám alatt jelenik meg. A saját munkamenetének azonosítóját kapja, és külön nyomvonal lesz belőle. A lánc tehát az üzeneteket köti össze, a mögöttük lévő munkát nem. A harmadik: a rendszer az ügyszámot csak a memóriájában tartja. Minden ügynökhöz azt az ügyszámot rendeli, amely a hozzá utoljára kézbesített üzenetben volt. Ha a rendszer közben újraindul, a lánc két darabra szakad.
Egy kérést tehát több ügynökön át, egyetlen szálon csak üzenet-szinten és közelítőleg látok. Ez nem teljes, végponttól végpontig tartó nyom. A cikk fejlécében lévő ábra ezért illusztráció: azt mutatja, hogyan szeretném látni, nem azt, hogy a rendszerem ma így rajzolja ki.
8. Auditnapló és nyomvonal
A nyomvonal azt mondja meg, mi történt és mennyi ideig tartott. Az auditnapló azt, hogy ki mit tett és mi lett belőle. A governance és az auditálhatóság kérdését a szeptemberi cikkben tárgyaltam; itt csak az auditnapló oldalát nézem: mi kerül bele, és honnan tudom, ki volt a hívó.
Az események több táblában élnek: az ügynök-audit (az entitás-írások), a kapu döntési naplója, a jóváhagyás-események, a jogosultságkezelés (RBAC) árnyéknaplója és a beállítás-változásnapló. Az elutasított műveletek részben események. Néhányuk külön művelet-névvel szerepel, a bérlők közti és a nem-címzetti elutasítás az ok mezőben. Az azonosítás-elutasítás viszont csak egy összesített számlálóban él, soronkénti audit-sor nincs hozzá. Az elutasítás nagy része tehát esemény, de nem mind.
Az azonosító forrása rögzül: token, munkamenet, eszköz vagy föderáció, és az is, hogy a hívó önbevallott volt-e. Ez fontos, mert egy megosztott kulcsnál a fejléc önbevallott lehet, és a nyom ezt nem takarja el. A bérlő-azonosító a szakaszokon és a naplótáblákon az adatbázisban van meg, az exportban pedig attribútumként kimegy a szakaszokon és a token-metrikákon. Nem viszik a folyamat-szintű számlálók, és néhány naplóforrás sem. Kimenő bérlő-szűrés nincs: az export minden bérlő exportálatlan szakaszait viszi.
9. Számokban
Itt is csak azt mérem, ami ellenőrizhető, és mindegyik mellé odaírom a módszert és a korlátját. Az „előtte” állapot október 12-i, az „utána” november 4-i, a forrásfa ugyanazzal a statikus átolvasásával mérve.
Mit mér: a tesztfájlok számát a forrásfában, két időpontban: a TypeScript-fájlok 676-ról 870-re, a Python-fájlok 30-ról 62-re, a shell-fájlok 24-ről 37-re nőttek. Mit nem mér: a tesztesetek számát és azt, hogy a tesztek jók. Egy fájl egy esetet is tartalmazhat, százat is. A 870 a fa állapota szerinti szám, a lefedettség csempéjén szereplő CI-futás 869 fájlról szól: az egy fájl különbség egy azóta hozzáadott teszt, a két mérés időpontja különbözik. Mérve: 2026. november 4.
Mit mér: azokat a CI-lépéseket (a CI az automatikus ellenőrzés, amely minden változtatáson lefut), amelyek egy mért számot rögzítenek, és megbuktatják a változtatást, ha az rosszabb lesz (például adatbázis-elérés, naplóüzenetek, a tesztek aszinkron-hibái). Október 12-én kettő volt, ma hat. Mit nem mér: azt, hogy a rögzített szám jó, csak azt, hogy nem romlik. Mérve: 2026. november 4.
Mit mér: a változtatás fő ágba olvasztása utáni CI-futás eredményét, 2026. november 4-én délelőtt: 867 tesztfájl futott le (2 kihagyva), 16 039 teszt sikeres, 5 kihagyva (összesen 16 044). A lefedettség (a vitest teszt-futtató v8 szolgáltatójával mérve, a forráskódra, a tesztek és a böngészős modulok nélkül): utasítás 85,3%, ág 83,1%, függvény 88,3%, sor 86,8%. Mit nem mér: azt, hogy a tesztek jók (a lefedettség azt mutatja, mely sorok futottak le, nem azt, hogy az állítások helyesek). „Előtte” értéket nem adok: az egyetlen korábbi mérésem egy helyi, szeptember végi futás volt (utasítás 78,4%, sor 80,0%), nem CI-futás, ezért a különbséget nem állítom növekedésként.
10. Mit nem old meg ez
Mit nem old meg ez. Nincs mintavételezés: minden szakasz kimegy. Nincs önálló SIEM-kivezetés, csak a naplók OTLP-n át. Nincs kimenő bérlő-szűrés, az export minden bérlő szakaszait viszi. A hitelesítő fejléc csak környezeti értékből adható meg, és nincs egyedi tanúsítvány vagy kliens-tanúsítvány. A kötegelés rögzített értékekkel megy, felületről nem állítható. Az export-hibaszámlálóknak nincs fogyasztójuk, és a hibázó gyűjtő éppen nem látja őket. Az ügynökök közti lánc a memóriában él, és újraindításkor szétszakad; a fogadó munkája külön nyomvonal. A költségkeret jelez, de nem állít le, az ütemezett ellenőrzés ezen a telepítésen nem fut. Az OpenTelemetry konvenció mai állapotát külső forrásból nem ellenőriztem. Független átvilágítás ezt a részt nem érte.
11. Ami következik
A sorozat kérdése az, mit ad egy kisvállalkozásnak vagy egy nagyobb cégnek ez a rendszer az eredetihez képest. A megfigyelés terén a válasz három dolog: egy szabványos nyom, amelyet kivezethetek, egy tudatosan szűkre vett rögzítés (metaadat, tartalom nélkül) és egy szabály arra, hogy a nulla mikor nem bizonyíték. Mindegyiknek megvannak a korlátai, ezeket a 10. pontban leírtam.
Látom, mi történik. De miért kell mindezt így csinálni? Mert a szabály ma már nemcsak ellenőriz, hanem alakítja is a rendszert. Ami eddig a kapuról, a naplóról és az emberi felügyeletről szólt, az a szabályozásban kötelezettség lett. A következő rész arról szól, mi történik, ha egy szabály nem utólag ellenőriz, hanem előre alakítja a rendszert.
English version
In brief, for readers with no background. In a system that runs agents, every action leaves a trace, or should: who asked for it, which agent worked on it, which tool it called, what it cost, and how it ended. I can export that trace in a standard format to an external monitoring system. I show what I record and what I do not, how the whole thing once broke without anything signalling it, and what is still missing. This part can be read without the earlier ones.
“For the second time, I got burnt by the same thing.” In the third part a gate showed zero refusals for weeks, and zero did not mean that the rules were good. This time the monitoring itself stayed silent: the export of measurements “worked”, while, according to the description of the fix, the receiving side rejected every request and I saw none of it.
The lesson of the third part was that silence is not evidence. This part translates it to monitoring: if my system says it is watching, it does not follow that it can see. Monitoring needs monitoring too. I describe how I found that out the second time, what my system records now, what it does not, and what is still missing.
The question of the series is unchanged: what does a small business or a larger company gain from the fact that I developed the original personal assistant further into my own system? For monitoring, the answer is that a company does not ask how many measurements I collect, but whether, when something breaks, I see anything and can say what happened. In section 10 I also write down where things are still awkward.
1. What do I want to see?
Imagine one request. A user asks the first agent for something, it calls a tool, then hands a subtask to another agent, which also calls a tool. At the end there is a result and a cost. I have three questions about it. What happened, and in what order? Who did it, or rather, on whose behalf? What did it cost?
The first question is answered by the timeline view of a trace. It shows the steps of one request along a time axis: each step is a bar (a span), the length of the bar is the time, and the staircase is the order. The picture at the top of the article is of this kind, but it is an illustration, not the output of my system. The second question is the one from the third part: it is not enough to know which agent worked, you also have to know on whose behalf. The third question is answered by cost measurement, which I describe in section 6.
I described the test of operability earlier; this part is its visibility side: anyone who operates a system also needs to know whether a failure becomes apparent.
2. A common language: OpenTelemetry
I did not want to invent my own format. OpenTelemetry is a standard, vendor-neutral description of how to send measurements to an external collector (the collector is the system that receives, stores and displays them). It has three signal types: traces (made of spans, the bars of the timeline view), metrics (numbers that change over time, such as token usage) and logs (individual events). I wrote about standardisation in an earlier article; the practical argument here is that something standard does not tie me to one particular viewer.
What does it look like in my system? It sends traces, metrics and logs in JSON format over OTLP/HTTP, the transport protocol of OpenTelemetry. Traces and metrics have been part of it from the start; the log signal has existed since mid-October and goes out only if I switch it on. Outgoing requests go in batches on a 30-second cycle, with at most 500 spans per batch and a 10-second timeout; if the collector does not answer, the system retries with growing pauses. These are fixed values and cannot be changed from the interface.
Most of the settings live on the Settings screen and take effect without a restart: on or off, the address of the collector, the service name, the switches for the logs. The default for every signal is off. The authentication header (typically an access key) can be given only as an environment value, not from the interface, and it goes out only over an encrypted connection or inside a private network; credentials in the address are forbidden, and redirects are disabled.
Some things are missing. There is no gRPC and no other protocol. There is no custom certificate, client certificate or certificate-verification setting. There is no sampling: every closed span goes out. There is no standalone SIEM export (a SIEM is the central monitoring system for security events); the only route is the logs over OTLP to an external collector. As I see it, these are beyond the level of small businesses: there is demand for them only in enterprise environments, and for now that is not the user group I am aiming at.
Many of the attribute names follow the emerging AI-specific convention of OpenTelemetry (model, provider, token usage, tool name). Where that convention stands exactly, and whether my names match the current version of the specification, I could not verify against an external source at the time of writing. So all I claim is this: I aligned the names with the state used in the code, and I do not say that they conform to today’s version of the specification.
3. What I record and what I do not
A span carries this metadata: the model and the provider, token usage (a token is a unit of text the model processes; input, output, cache read, cache creation), the name of the tool, the MCP server (the program that provides the tools) and the tool within it, the identifier and name of the agent (only on the agent span), the tenant identifier (a tenant is a separately managed user organisation), and the sender and recipient of messages. The names of the spans are descriptive too: a model call, a tool call or an agent call. The reasoning token (when the model “thinks” before answering) lives in a separate column in storage, but in the export it goes into an “other” total together with the cache.
By default I do not record content. The export of the audit log carries no content column, users appear under pseudonyms (keyed fingerprints), and the application log sends only the message template, stripped of credentials and paths and cut to 160 characters. A short summary of the incoming request sits behind a separate switch, which is off by default. I have one reservation: I have not examined the exact boundary of the span attribute filtering all the way through, so I say “content is not included” only for the audit log and the application log, and for spans only that the summary is behind a separate switch.
The reasons are twofold. One is data protection: for a trace to be useful, it does not need to know what someone wrote. The other is practical: I do not want to build one more data archive next to the existing ones, which I would have to protect and delete separately. Retention matches this: I keep spans for 30 days by default (it cannot be set below 7 days) and the audit tables for 90 days.
4. The silent export
I switched the export on from the interface on 9 September 2026; the settings log has this at 15:17. The fix was ready the next morning at 04:20 and merged by 04:32. From switching on to the fix, roughly thirteen hours passed. Not even a full calendar day. It still belongs here, because the point is not how long it lasted, but that nothing said a word in that time.
The bug was simple. The standard expects the trace identifier in 32 and the span identifier in 16 hexadecimal characters. I passed session, message, tool-call and transcript identifiers, lower-cased, without hyphens, and these are not that long. According to the description of the fix, standard collectors typically reject this with a 400 error code, and my system showed nothing of it on the interface. What the collector of the time answered exactly, I did not read back from the log, so I do not state it as an observed fact. Since the fix, I derive the identifier from a deterministic SHA-256 value, cut to the required length, so the same input always gives the same result.
What did I see on the interface? Nothing. The system wrote one warning line into the process log (“the collector rejected the export”), the batch was not marked as exported, but there was no error counter, status line or warning on the interface.
What has changed since? The system treats the responses 400, 413, 415 and 422 as final: it drops the batch and counts it. It retries on every other unsuccessful answer. If the collector accepts a request only partially, the rejected part is counted too. Two counters show this, per signal type. That is good, but it has a flaw, and it is the same flaw the silent export had: these counters have no consumer today. There is no screen and no endpoint for them. On top of that they get out only when the collector is reachable again, so a failing collector is exactly the one that does not see them. So the monitoring still has no view of its own.
5. Zero and the canary
The rule of the third part is that zero is not evidence. Since then I have applied it to a newer measurement, and it is the most instructive small example in this part.
The use of the shared access key is measured by a counter before I actually block the shared key. This counter only counts: it neither allows nor forbids anything. It keeps aggregated daily rows (day, category, route template, caller, how the caller was identified), keeps them for 90 days, and has a ceiling of 4,000 rows a day. If it shows zero at the end, there are two explanations: nobody used the key, or the counter is not alive. From the outside the two look the same.
That is why the decision gate (the check that decides on the blocking) makes a deliberate canary call at the start of every run (a known, manually triggered use), and today’s counter has to grow by at least one. If it does not, the result is “cannot be decided”, and never “compliant”. The rule is there in the code of the gate. Whether the counter was ever truly dead, I cannot claim; the example comes from the rule set, not from an incident.
The second trap is time. A task scheduled monthly or less often can fall out of a measuring window of at least eight days (seven full days and today), and then zero again does not mean what I would assume. So the task has to be run manually inside the window too, otherwise the result is just as “cannot be decided”. Monitoring the monitoring is therefore two rules in my system: zero has to stand behind a counter that is provably alive, and the window has to cover the schedule.
6. Cost: in tokens, with a warning
The system measures cost in tokens, not in money. There is no price list in its bookkeeping, so the budget also relates to the token quantity and does not show forints or dollars. I store tokens in separate columns: input, output, cache read, cache creation and reasoning. The reasoning token is therefore stored in a column of its own.
The cost budget compares the monthly token use with the budget. It warns at eighty per cent, gives a hard signal at a hundred per cent, sends a message to the configured channel (Telegram on this installation), and observes a cool-down period so that it does not nag. It only signals, it does not stop anything: the “block” field changes the text, and there is no actual action behind it. The function of the check, its command and its template exist, but the regular, scheduled check does not run on this installation. I made that decision deliberately, which is why I describe the budget as a signal and not as a working protection.
One thing I spell out so that nobody misreads it: when the monthly use reaches 100 per cent of the budget, the system does not stop because of it. Work that runs locally (the memory search done with a local model, and scheduled tasks of the command type, which run without a model) carries on living and working, because it consumes no cloud tokens. The budget does not stop cloud calls either, since it only signals.
7. The trail between agents
Agents send messages to each other, and I want to see how a request travels among them. I will show with an example what I can see of this, and what I cannot. The example is fictional.
A user asks agent A to prepare a monthly summary. Agent A cannot do it alone, so it sends a message to agent B: collect the figures. Agent B works, then replies. Agent A writes the summary from the figures and hands it to the user. There are four steps: the request, the message from A to B, the reply from B to A, and the final answer.
What ties the messages together? An identifier, something like a case number. The rows of the message table have room for three identifiers: the trace identifier (this is the case number, the same for every link in the chain), the span identifier (the message’s own identifier) and the parent identifier (which message, the last one that had reached the sender, it was sent after). The system fills them in at delivery. The sender cannot supply one. At the same time it creates a message span. It holds the names of the sender and the recipient. So the two messages form a chain: I can see that agent A asked, agent B answered, and when. The chain shows which message came after which. It does not show that one was really caused by the other.
I know less than that, for three reasons. First, agent B does not see the case number, because it is not in the text of the message. Second, what agent B does in the meantime (reads, calculates, calls a tool) does not appear under the case number. It gets the identifier of its own session and becomes a separate trace. The chain therefore ties the messages together, not the work behind them. Third, the system keeps the case number only in its memory. For each agent it uses the case number from the last message delivered to that agent. If the system restarts in between, the chain breaks into two pieces.
So I can follow one request across several agents in a single thread only at message level and approximately. It is not a complete, end-to-end trail. The picture at the top of the article is therefore an illustration: it shows how I would like to see it, not that my system draws it this way today.
8. Audit log and trace
The trace says what happened and how long it took. The audit log says who did what and what came of it. I discussed governance and auditability in the September article; here I look only at the audit side: what goes into it, and how I know who the caller was.
The events live in several tables: the agent audit (entity writes), the decision log of the gate, the approval events, the shadow log of the access control, and the settings change log. Refused actions are only partly events. Some appear under a separate action name; cross-tenant refusals and refusals of non-recipients go into the reason field. A failed identification, however, lives only in an aggregate counter, with no row-by-row audit entry. Most refusals are therefore events, but not all.
The source of the identifier is recorded: token, session, device or federation, and also whether the caller was self-declared. That matters because with a shared key the header can be self-declared, and the trail does not hide this. The tenant identifier is present on spans and log tables in the database, and in the export it goes out as an attribute on spans and on the token metrics. Process-level counters do not carry it, and neither do a few log sources. There is no outgoing tenant filtering: the export carries the unexported spans of every tenant.
9. In numbers
Here too I measure only what can be checked, and next to each figure I give the method and its limit. The “before” state is 12 October, the “after” state is 4 November, measured by the same static reading of the source tree.
What it measures: the number of test files in the source tree at two points in time: TypeScript files grew from 676 to 870, Python files from 30 to 62, shell files from 24 to 37. What it does not measure: the number of test cases, or whether the tests are good. One file can hold one case or a hundred. The 870 is the count in the state of the tree, while the CI run on the coverage tile covers 869 files: the one-file difference is a test added since, because the two measurements were taken at different times. Measured: 4 November 2026.
What it measures: the CI steps (CI is the automatic check that runs on every change) that pin a measured number and fail a change if it makes that number worse (for example database access, log messages, asynchronous faults in the tests). On 12 October there were two, today there are six. What it does not measure: whether the pinned number is good, only that it does not get worse. Measured: 4 November 2026.
What it measures: the result of the CI run after the merge to the main branch, on the morning of 4 November 2026: 867 test files ran (2 skipped), 16,039 tests passed, 5 skipped (16,044 in total). The coverage (measured with the v8 provider of the vitest test runner, on the source code only, excluding the tests and the browser modules): statements 85.3%, branches 83.1%, functions 88.3%, lines 86.8%. What it does not measure: whether the tests are good (coverage shows which lines ran, not whether the assertions are right). I give no “before” value: my only earlier measurement was a local run at the end of September (statements 78.4%, lines 80.0%), not a CI run, so I do not state the difference as growth.
10. What this does not solve
What this does not solve. There is no sampling: every span goes out. There is no standalone SIEM export, only the logs over OTLP. There is no outgoing tenant filtering: the export carries the spans of every tenant. The authentication header can be given only as an environment value, and there is no custom certificate or client certificate. Batching runs on fixed values and cannot be set from the interface. The export failure counters have no consumer, and a failing collector is exactly the one that does not see them. The chain between agents lives in memory and breaks on a restart; the recipient’s work is a separate trace. The cost budget signals but does not stop anything, and the scheduled check does not run on this installation. I did not verify the current state of the OpenTelemetry convention from an external source. No independent review has covered this part.
11. What comes next
The question of the series is what this system gives a small business or a larger company compared with the original. For monitoring, the answer is three things: a standard trail that I can export, a deliberately narrow record (metadata, no content), and a rule for when zero is not evidence. Each has its limits, which I wrote down in section 10.
I can see what is happening. But why do all of this in this way? Because a rule today no longer merely checks: it shapes the system in advance. What so far was about the gate, the log and human oversight has become an obligation in regulation. The next part is about what happens when a rule does not check afterwards but shapes the system in advance.