AMI - AI-Managed IT
AI-alapú, adatvezérelt IT döntéstámogatás
AI-based, data-driven IT decision support
An English version of this article follows below. Jump to the English version.
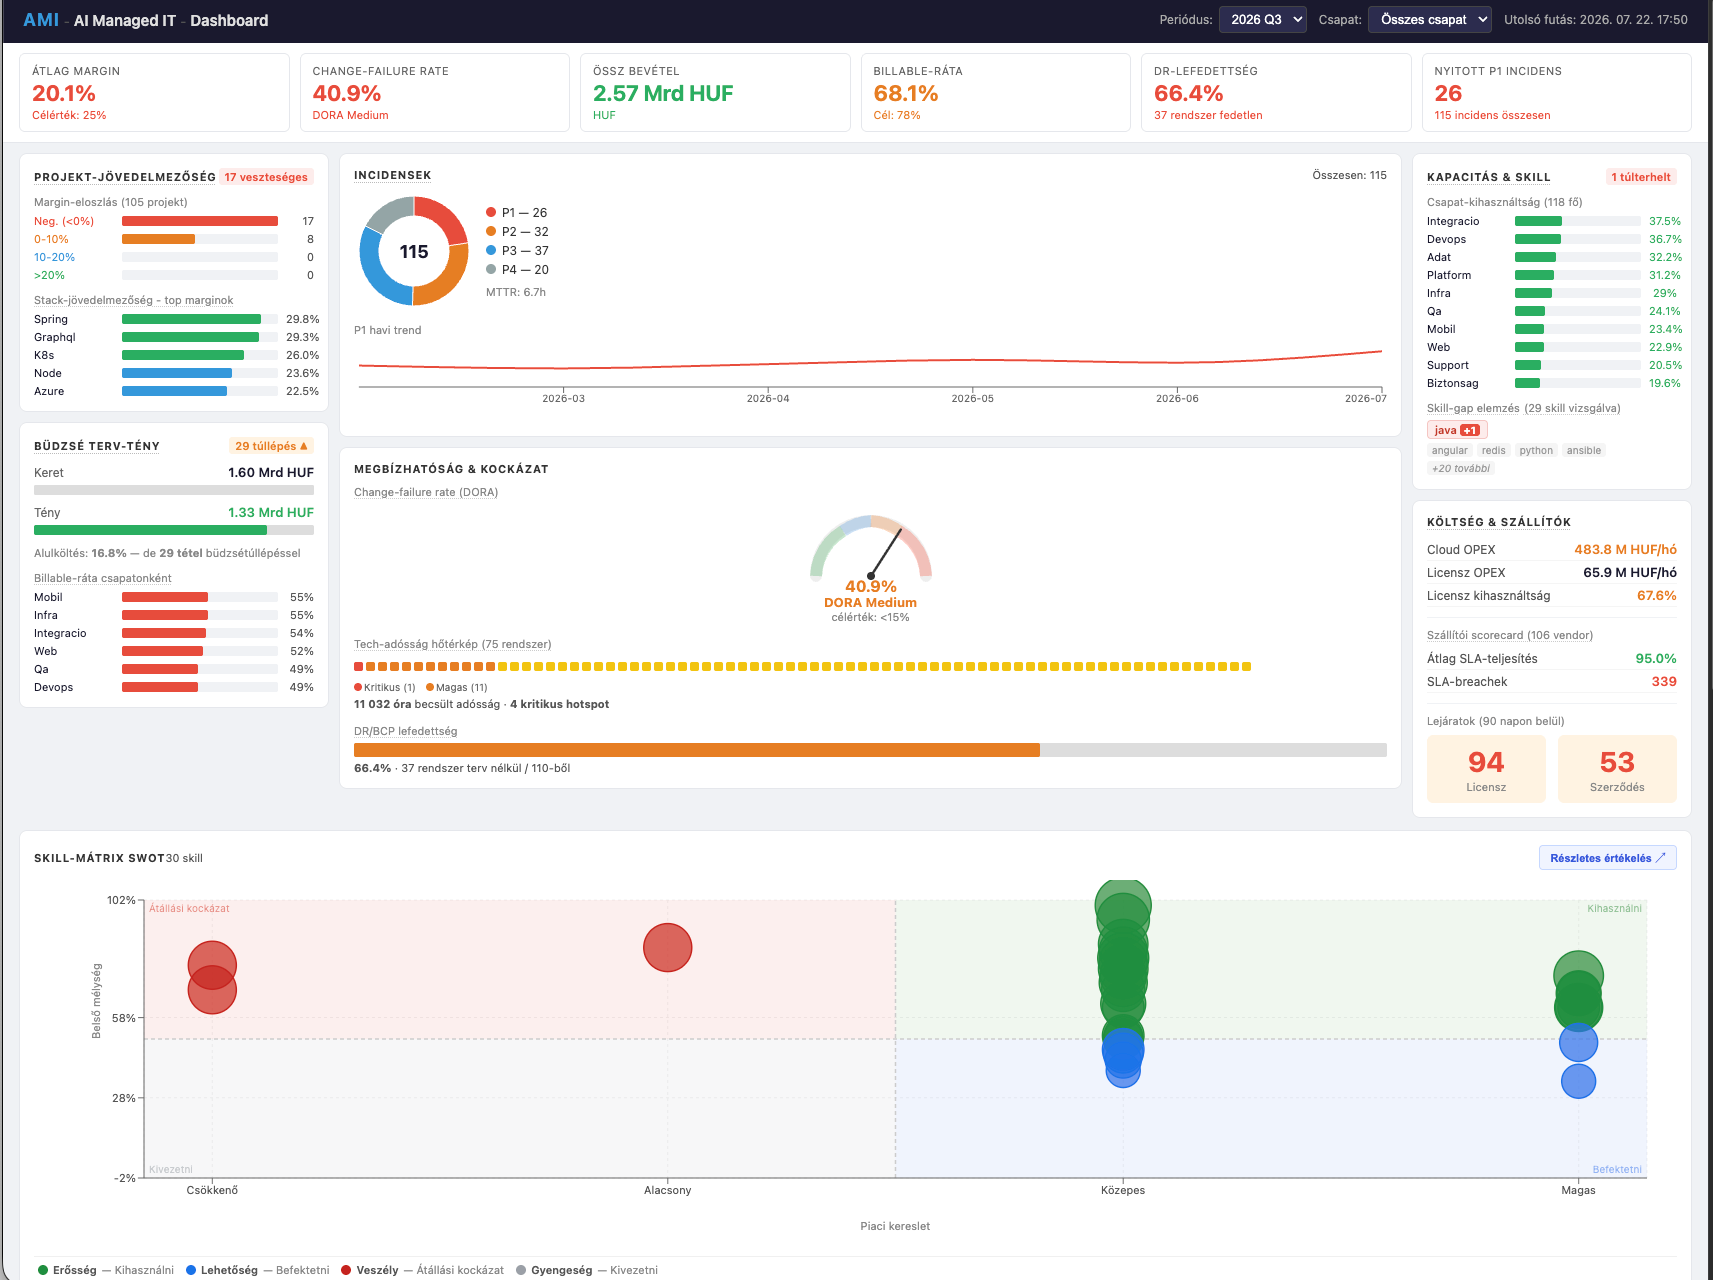
Az AMI (AI-Managed IT) egy cégfüggetlen, újrafelhasználható keretrendszer arra, hogy egy on-prem AI fleet ne csupán ad hoc segítséget nyújtson egy nagyvállalati IT vezetőnek, hanem strukturált, ismételhető és adatvezérelt döntéstámogatást. Az IT szervezet valós adatait standard fájlsémában tároljuk, és erre specializált agensek által gyártott, automatizálható riportokat futtatunk – numerikus számítással és szöveges elemzéssel együtt.
1. Alapkoncepció
Az AMI projekt abból a helyzetből nőtt ki, hogy Jónás nagyvállalati informatikai vezető (CTO/IT-igazgató) szerepre készül, ahol kb. 60-70 fős IT szervezet felett kellene irányítói döntéseket hoznia. A kérdés az volt: hogyan lehet egy on-prem AI fleet-et úgy bekötni ebbe a munkába, hogy ne csupán ad hoc segítséget nyújtson, hanem strukturált, ismételhető és adatvezérelt döntéstámogatást biztosítson – cégfüggetlenül, újrafelhasználható keretrendszerként.
Az alapkoncepció: az IT szervezet valós adatait standard fájlsémában tároljuk, és erre specializált agensek által gyártott, automatizálható riportokat futtatunk – numerikus számítással és szöveges elemzéssel együtt.
Fontos: az AMI irányítópultja nem valós idejű üzemeltetési monitoring, hanem rendszeres szakmai riportokra épülő döntéstámogató felület. A kapacitás-dashboard hetente frissül, a licenclejárat-előrejelzés és az üzemelési esemény-összefoglaló havonta, a szaktudáshiány-elemzés és a szállítói teljesítés-értékelés negyedévente, a teljes stratégiai összekép félévente. Ez tudatos tervezési döntés: a nagyvállalati IT vezető nem valós idejű műszerfalat igényel, hanem rendszeres, mélységi elemzést, amely alapján stratégiai és szervezeti döntéseket hozhat.
2. Adatarchitektúra – az alap
Az első konszenzusos döntés az adatstruktúra kialakítása volt. Dave (IT menedzsment), Rick (architektúra) és Zoe (pénzügy) közösen határozta meg a logikát: az IT szervezeti adat négy „hőfokra" tagolódik.
Statikus szervezeti adat verziókezelt YAML/JSON fájlokban: a személyek szaktudástérképe (1-5 szintű menedzser-értékelés, nem önértékelés), a szervezeti hierarchia, a RACI-szerepkörök. Projektek kanban-kártyák strukturált metaadattal: ügyfél, technológiai stack, szereplők, tervezett és tényleges ráfordítás, bevétel. Eszközpark, licencek, szerződések saját JSON katalógusban. Incidensek strukturált naplóban, súlyossági besorolással (P1-P4), helyreállítási idővel és gyökerokkal.
A konvenció: minden azonosító ember által olvasható (pl. janos-kovacs, microsoft-365), minden dátum ISO 8601, minden összeg forintban. Ez teszi lehetővé, hogy az agensek adatforrásokat automatikusan összekapcsoljanak kézi előkészítés nélkül. A végső adatmodell 23 fájlból áll – a személynyilvántartástól a kockázati nyilvántartáson, a változásnaplón és a szállítói scorecarden át a katasztrófa-helyreállítási tervek státuszáig.
3. A riportrendszer felépítése
Huszonegy riportot specifikáltunk, szakterület szerint felosztva:
Zoe (pénzügy) a pénzügyi elemzéseket adja: büdzsé vs. tényleges, szállítói teljes tulajdonlási költség (TCO), devizakitettség, felhőköltség-trend.
Rick (architektúra) az infrastrukturális és biztonsági képet nyújtja: felhőköltség-anomália, biztonsági kockázati összekép, nem engedélyezett IT-eszközök feltérképezése.
Dave (IT menedzsment) a kapacitás-, megbízhatósági és szaktudás-elemzéseket készíti: kapacitás-dashboard, üzemelési esemény-trend, licenclejárat-előrejelzés, szaktudáshiány-elemzés, katasztrófa-helyreállítási terv állapota – és a három korrelációs riport.
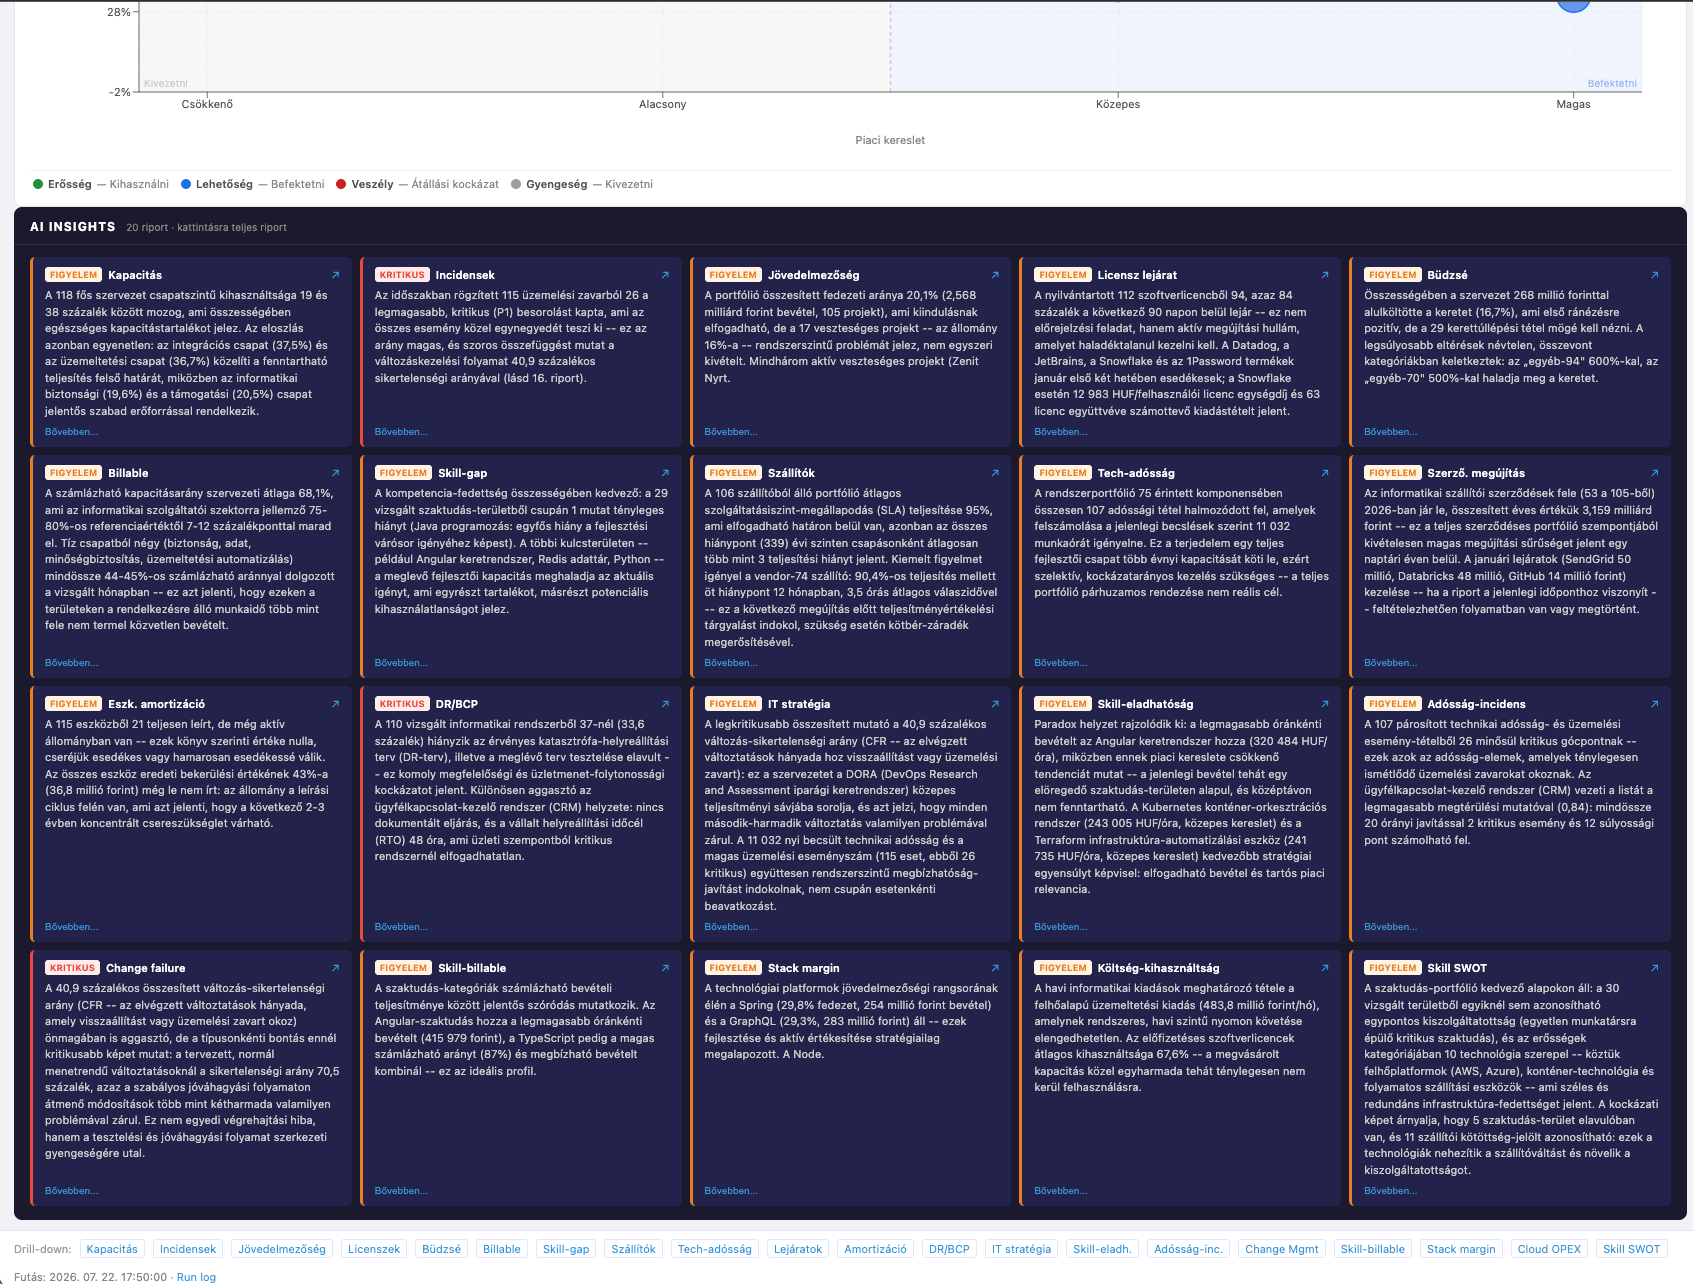
A 13. riport (IT-stratégiai összekép) az összes többi riport mutatóiból szintetizált vezető összefoglaló: egyetlen oldalon látni a jövedelmezőséget, a megbízhatóságot, a kockázatot és a szállítói teljesítést.
4. Döntési pontok
Több fontos döntés formálta a projektet.
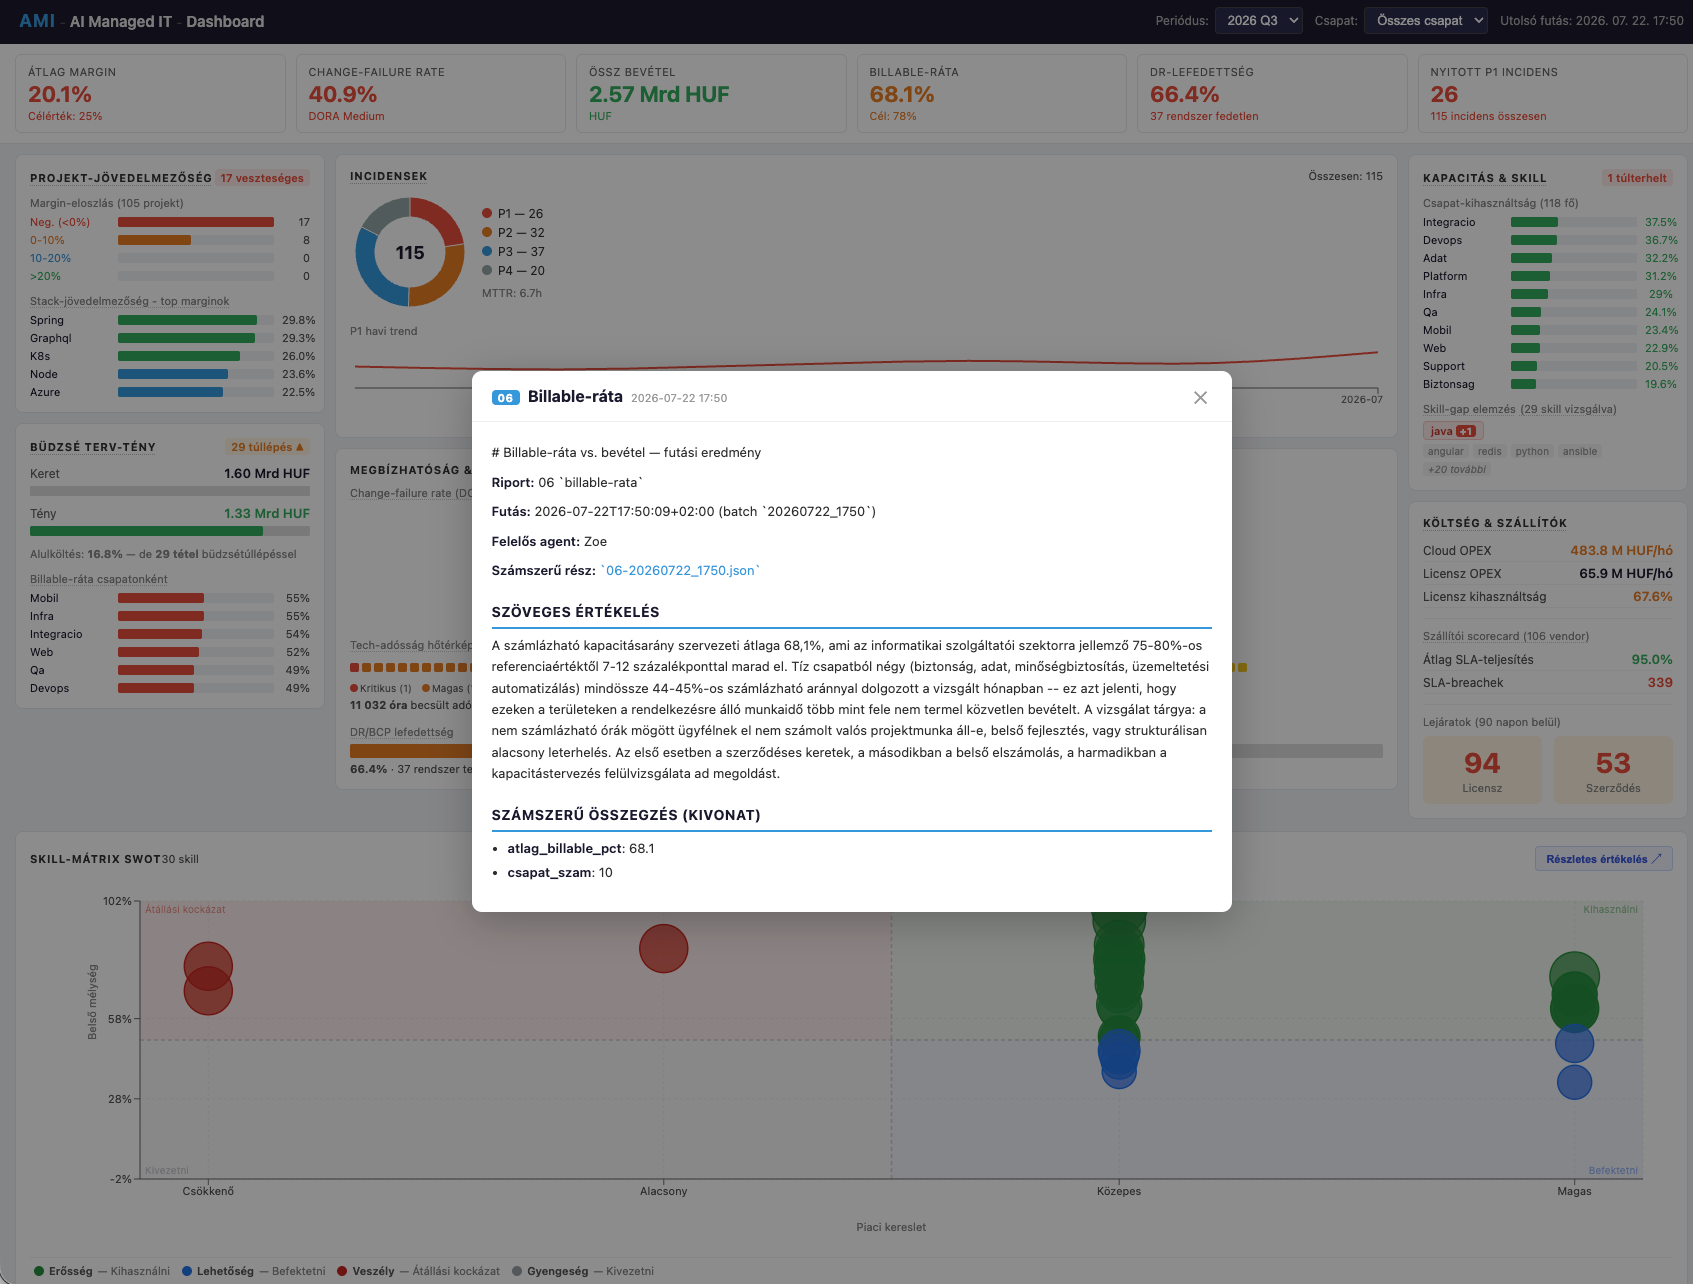
Az első a hibrid futtatási modell. Jarvis Python-scripttel kiszámítja a numerikus részt (minden összekapcsolást, aggregációt, metrikát, küszöb-jelzést) és a számokat strukturált JSON-ban adja át. A felelős agens ezután megírja a szöveges értékelést: mit mutatnak a számok, mi a kockázat, mi a javasolt teendő. Jarvis beépíti a szöveget a riportfájlba és commitolja a GitLab repóba. A számítás determinisztikus és auditálható, a szöveges elemzés a szakterületi agens „hangján", „személységén" és „szaktudásával" szól.
A második döntés a szöveges értékelések stílusáról szólt. Az első futás után Jónás visszajelzett: az értékelések IT-igazgatói szóhasználatot kapjanak, felesleges anglicizmusok nélkül, és ahol szakszó elkerülhetetlen (MTTR – átlagos helyreállítási idő, DORA – iparági érettségi keretrendszer, CFR – változás-sikertelenségi arány), az első előforduláskor adjuk meg magyarul is. Ez bekerült a működési standardba.
A harmadik döntés a szaktudás SWOT-vizualizációjáról szólt. Az egyszerű négyes doboz helyett kéttengelyes buborék-diagramot választottunk: X-tengelyen a piaci kereslet (0-3 skálán), Y-tengelyen a belső mélység (normált létszám × szintátlag), buborékméretként a fejfőszám. Egy nagy buborék a csökkenő keresletű oldalon azonnal jelzi, hogy sok munkatárs ragad be egy elavuló technológiában – ez az igazi szervezeti kockázat, amelyet egy statikus táblázat nem mutat meg.
5. A korrelációs riportok – a projekt magja
Az AMI legértékesebb részei a keresztmetszetű elemzések, amelyek több adatforrást kapcsolnak össze és korrelációkat azonosítanak. Ezek azok a riportok, amelyeket egyetlen hagyományos adatelemző eszköz sem tud automatikusan előállítani, mert a szöveges értelmezés és a döntési logika nem parametrizálható.
A technikai adósság és az incidensek korrelációja (15. riport) összekapcsolja az adóssági nyilvántartást az incidensadatbázissal, és kiszámítja, melyik adósságelem mekkora üzemelési terhet okoz. Az eredmény nem egy lista az összes technikai adósságról, hanem priorizálási sorrend: melyik 20 órányi javítás szünteti meg a legtöbb kritikus eseményt? Ez ROI-alapú döntéstámogatás, nem technológiai vélemény.
A változás-sikertelenségi arány (16. riport) a DORA (DevOps Research and Assessment) iparági keretrendszer alapján méri a változáskezelési érettséget. A dummy adatokon kapott 70,5 százalékos sikertelenség a tervezett változásoknál strukturális problémát jelez: nem egyedi hibák, hanem a tesztelési és jóváhagyási folyamat gyengesége. Szembeötlő paradoxon: a sürgős beavatkozások 39 százalékos sikertelenségi arányával szemben a tervezett változások közel kétszeres arányban buknak meg. Ez az az elemzés, amely alapján egy IT-igazgatónak változáskezelési bizottságot kell reformálnia.
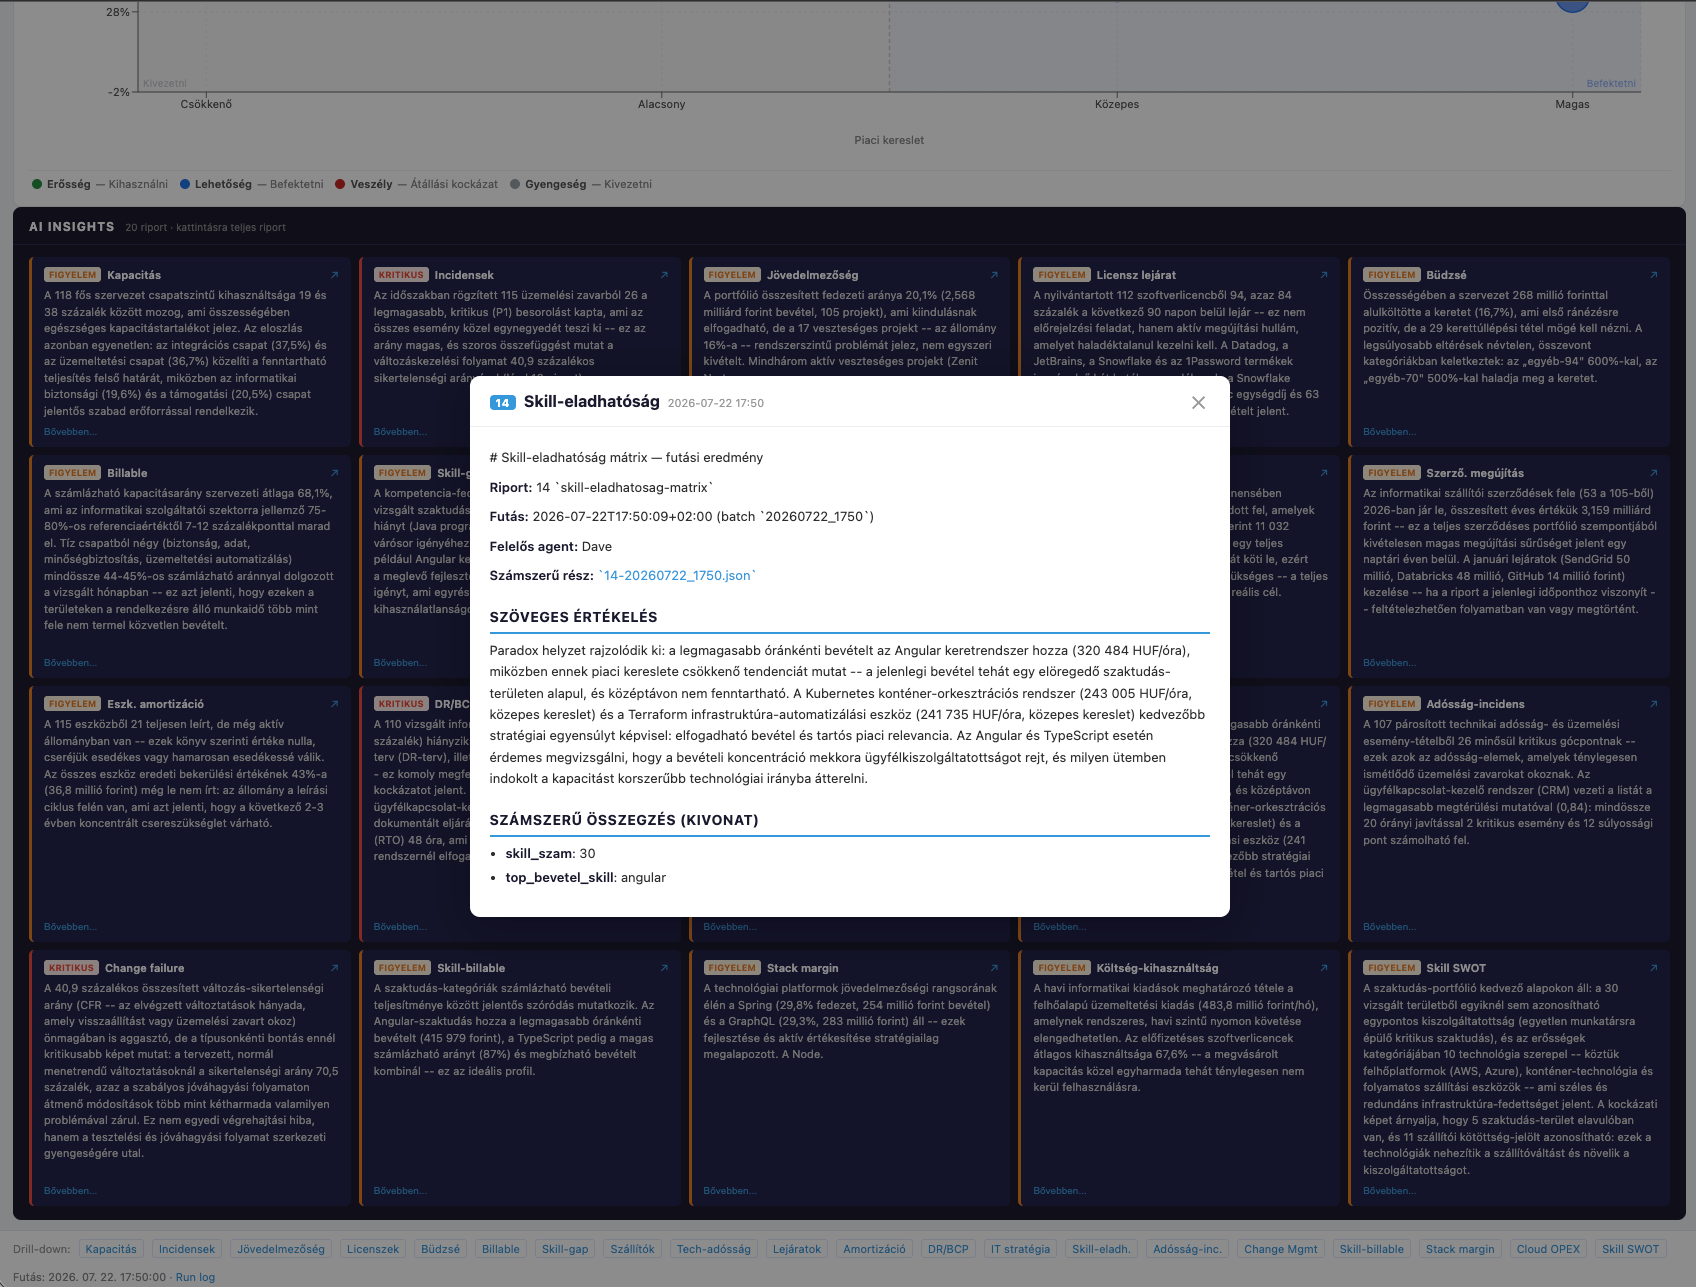
A szaktudás-jövedelmezőség (14. riport) a személyek szaktudástérképét, a projektek bevétel- és margin-adatait és az időnyilvántartást kapcsolja össze: melyik technológiai kompetencia termel valós bevételt magas margin mellett, és melyik „áll a polcon"? A dummy adatokon az Angular keretrendszer volt a legjövedelmezőbb (320 484 HUF/óra), de csökkenő piaci kereslettel – ez stratégiai portfólió-döntést igényel.
6. Az agent flotta együttműködése
Az AMI projekt megmutatta, hogy a Marveen fleet koordináltan dolgozó szaktanácsadói csapatként működik.
Jarvis orchestrált: összegyűjtötte a négy agens (Dave, Rick, Zoe, Zack) szakterületi inputjait, kérdésenként szintetizálta, és artifact formában adta át Jónásnak. A technikai futtatást (Python-script, JSON-generálás, Git-commit a repóba) szintén Jarvis végezte.
Dave az IT menedzsment nézőpontját hozta: kapacitás-egyenletlenség, kockázati rangsorok, változáskezelési folyamat-érettség, szállítói teljesítés, katasztrófa-helyreállítási tervek állapota.
Poly a vizualizációért felelt: a SWOT buborék-diagramot Dave analitikai logikájára és Poly vizuális tervezési elvei szerint alakították ki, Recharts-kompatibilis specifikációval.
Zack a frontend-implementációt vállalta: a dashboard-komponenseket a specifikáció alapján építi be a webalkalmazásba.
Zoe a pénzügyi szaktudást adta: TCO-számítások, licencköltség-optimalizálás, szállítói ROI-elemzések.
Ez a szétválasztás nem csupán munkamegosztás: ha valamelyik riporttal vitába kell szállni, vagy mélyíteni kell, az a felelős agens tudásbázisán és szerepkörén belül marad.
7. A végeredmény és hasznosíthatóság
Az AMI projekt eredménye egy működőképes, 21 riportból álló elemzési keretrendszer és egy ehhez épített webes irányítópult. A riportok fájl-alapú adatokból futnak, az eredmények Markdown és JSON formátumban kerülnek a repóba, és a futtatás ütemezett fleet-taskként automatizálható.
A keretrendszer generikus: nem egyetlen cégre szabott, hanem bármely 20-200 fős IT szervezetre alkalmazható, ahol az adatfájlokat egyszer feltöltik és karbantartják.
Egy nagyvállalati IT vezető szemszögéből az AMI azt oldja meg, ami a legtöbb igazgatónak a legnagyobb gondja: az adatok megvannak valahol szétszórva, és összefésülésükhöz mindig ember kell. Az AMI automatizálja ezt, és mindezt döntésorientáltan, javaslatot is tartalmazó szöveges értékeléssel tálalva. Nem nyers adatot ad, hanem értelmezett, akcióképes összefoglalót – az igazgatónak nem egy táblázatot kell értelmeznie, hanem egy döntési javaslatot kap.
A projekt tanulsága: az AI fleet-alapú IT-menedzsment nem helyettesíti az IT-igazgatói ítélőképességet, hanem adatot és szerkezetet ad ott, ahol eddig csak intuíció volt.
Van kérdésed, vagy beszélgetnél a témáról? Írj emailben: info@jonasgergo.hu, vagy keress meg LinkedInen.
English version
AMI (AI-Managed IT) is a reusable framework, not tied to any one company, that lets an on-prem AI fleet give a large-enterprise IT leader not just ad hoc help but structured, repeatable, data-driven decision support. We store the real data of the IT organisation in a standard file schema, and run automatable reports on it, produced by specialised agents, combining numerical calculation with written analysis.
1. The basic concept
The AMI project grew out of Jónás preparing for the role of a large-enterprise IT leader (CTO/IT director), where Jónás would have to make management decisions for an IT organisation of about 60-70 people. The question was how an on-prem AI fleet could be built into this work so that it provides not just ad hoc help but structured, repeatable, data-driven decision support, independently of any one company, as a reusable framework.
The basic concept: we store the real data of the IT organisation in a standard file schema, and run automatable reports on it, produced by specialised agents, combining numerical calculation with written analysis.
Note that the AMI dashboard is not real-time operational monitoring but a decision-support interface built on regular expert reports. The capacity dashboard is refreshed weekly, the licence-expiry forecast and the operational event summary monthly, the skills-gap analysis and the supplier performance assessment quarterly, the full strategic overview half-yearly. This is a deliberate design decision: a large-enterprise IT leader does not need a real-time dashboard but regular, in-depth analysis on which to base strategic and organisational decisions.
2. Data architecture: the foundation
The first decision, reached by consensus, was how to design the data structure. Dave (IT management), Rick (architecture) and Zoe (finance) jointly defined the logic: the IT organisational data is divided into four layers.
The first layer is static organisational data in version-controlled YAML/JSON files: the skills map of the staff (rated by managers on a 1-5 scale, not self-assessed), the organisational hierarchy and the RACI roles. The second layer is projects, kept as kanban cards with structured metadata: customer, technology stack, people involved, planned and actual effort, and revenue. The third layer is assets, licences and contracts, kept in a JSON catalogue of our own. The fourth layer is incidents, kept in a structured log with severity classification (P1-P4), recovery time and root cause.
The convention: all identifiers are human-readable (for example janos-kovacs, microsoft-365), all dates are in ISO 8601 and all amounts are in forints (HUF). This is what allows the agents to link data sources automatically without manual preparation. The final data model consists of 23 files: ranging from the personnel register, the risk register, the change log and the supplier scorecard to the status of the disaster-recovery plans.
3. How the report system is built
We specified 21 reports, divided by area of expertise:
Zoe (finance) provides the financial analyses: budget vs. actual, the supplier total cost of ownership (TCO), currency exposure, cloud-cost trend.
Rick (architecture) gives the infrastructure and security picture: cloud-cost anomaly, the security risk overview, mapping of unauthorised IT assets (shadow IT).
Dave (IT management) prepares the capacity, reliability and skills analyses: the capacity dashboard, operational event trend, licence-expiry forecast, skills-gap analysis, status of the disaster-recovery plan, and the three correlation reports.
The 13th report (IT strategic overview) is an executive summary synthesised from the metrics of all the other reports: on a single page you can see profitability, reliability, risk and supplier performance.
4. Decision points
Several important decisions shaped the project.
The first is the hybrid execution model. Jarvis calculates the numerical part with a Python script (every join, aggregation, metric and threshold flag) and passes the numbers on in structured JSON. The responsible agent then writes the written assessment: what the numbers show, what the risk is, what the recommended action is. Jarvis inserts the text into the report file and commits it to the GitLab repository. The calculation is deterministic and auditable, while the written analysis speaks in the "voice", "personality" and "expertise" of the specialist agent for that domain.
The second decision was about the style of the written assessments. After the first run, Jónás gave feedback: the Hungarian-language assessments should use the vocabulary of an IT director, without needless anglicisms (English loanwords), and where a technical term is unavoidable (MTTR: mean time to recovery; DORA: the DevOps Research and Assessment maturity framework; CFR: change failure rate), its Hungarian equivalent should be given at first occurrence. This became part of the agents' standing guidelines.
The third decision was about the skills SWOT visualisation. Instead of a simple four-box grid, a two-axis bubble chart was chosen: market demand on the X axis (on a scale of 0 to 3), internal depth on the Y axis (normalised headcount × average level), and headcount as the bubble size. A large bubble on the side of falling demand immediately signals that many colleagues are stuck with an obsolete technology: this is the real organisational risk, and a static table does not show it.
5. The correlation reports: the core of the project
The most valuable parts of AMI are the cross-cutting analyses that link several data sources and identify correlations. These are the reports that no single traditional data-analysis tool can produce automatically, because written interpretation and decision logic cannot be parametrised.
The correlation of technical debt and incidents (report 15) links the debt register with the incident database, and calculates how much operational burden each debt item causes. The result is not a list of all technical debt but a prioritisation order: which 20 hours of repair work would eliminate the most critical incidents? This is ROI-based decision support, not a technology opinion.
The change failure rate (report 16) measures change-management maturity against the DORA (DevOps Research and Assessment) industry framework. In the synthetic sample data, planned changes fail 70.5 per cent of the time, which signals a structural problem: not individual faults but a weakness in the testing and approval process. A striking paradox: compared with a 39 per cent failure rate for urgent interventions, planned changes fail at nearly twice the rate. This is the analysis on the basis of which an IT director has to reform the change advisory board.
The skills profitability report (report 14) links the skills map of the staff, the revenue and margin data of the projects, and the timesheets: which technology competence produces real revenue at a high margin, and which one "sits on the shelf"? In the sample data the Angular framework was the most profitable (320,484 HUF per hour), but with falling market demand, which calls for a strategic portfolio decision.
6. How the agent fleet cooperates
The AMI project showed that the Marveen fleet (the on-prem AI fleet described above) works as a team of specialist advisers working in coordination.
Jarvis acted as orchestrator: it collected the expert input of four agents (Dave, Rick, Zoe, Zack), synthesised it question by question, and handed it over to Jónás as an artifact (a finished, self-contained document). The technical run (the Python script, the JSON generation, the Git commit to the repository) was also done by Jarvis.
Dave brought the IT-management viewpoint: capacity imbalance, risk rankings, change-management process maturity, supplier performance, the state of the disaster-recovery plans.
Poly was responsible for the visualisation: the SWOT bubble chart was shaped by Dave's analytical logic and Poly's visual design principles, with a specification compatible with Recharts (a charting library).
Zack took on the frontend implementation: building the dashboard components into the web application according to the specification.
Zoe contributed the financial expertise: TCO calculations, licence-cost optimisation, supplier ROI analyses.
This separation is not merely a division of labour: if a report has to be challenged or taken further, that stays within the knowledge base and role of the responsible agent.
7. The result and its practical value
The result of the AMI project is a working analysis framework of 21 reports and a web dashboard built on top of it. The reports run on file-based data, the results go into the repository in Markdown and JSON format, and the run can be automated as a scheduled fleet task.
The framework is generic: not tailored to a single company but applicable to any IT organisation of 20-200 people, where the data files are uploaded once and maintained.
From the point of view of a large-enterprise IT leader, AMI addresses what worries many directors most: the data exists somewhere, scattered, and a person is always needed to merge it. AMI automates this and presents the result in a decision-oriented way, with a written assessment that includes a recommendation. It does not give raw data but an interpreted, actionable summary: the director does not have to interpret a table; they receive a recommendation for a decision.
The lesson of the project: AI-fleet-based IT management does not replace the judgement of the IT director but gives data and structure where until now there was only intuition.
Do you have a question, or would you like to talk about the topic? Write to Jónás by email: info@jonasgergo.hu, or find Jónás on LinkedIn.